English
Kiomda Analytics
From the meter, your data is collected, read, and remains actionable over time — all on a single platform.
What the platform brings you
Attendance tracking is only valuable if the data is transmitted without loss, is easy to read at a glance, and remains actionable over time.
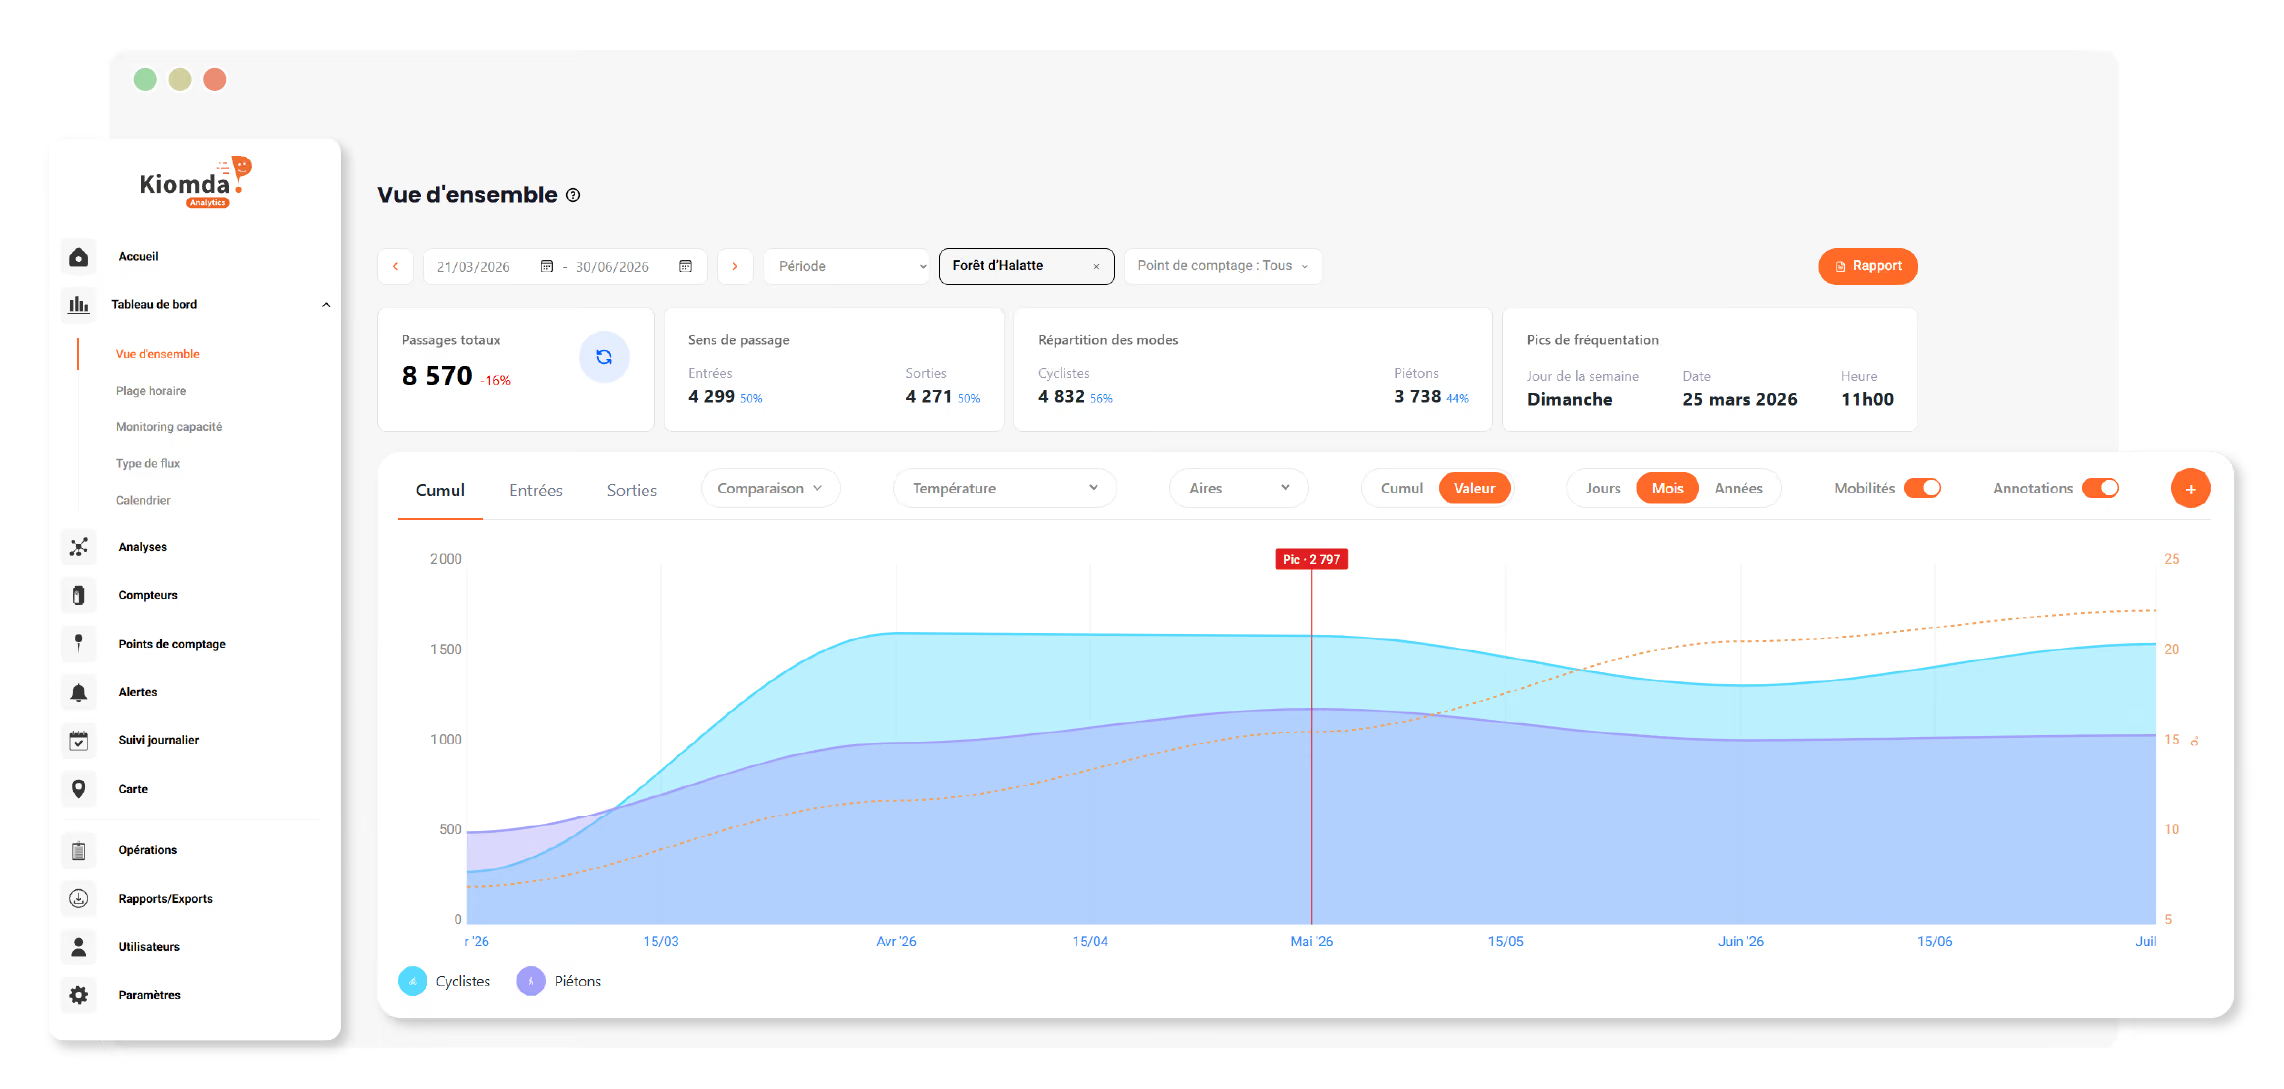
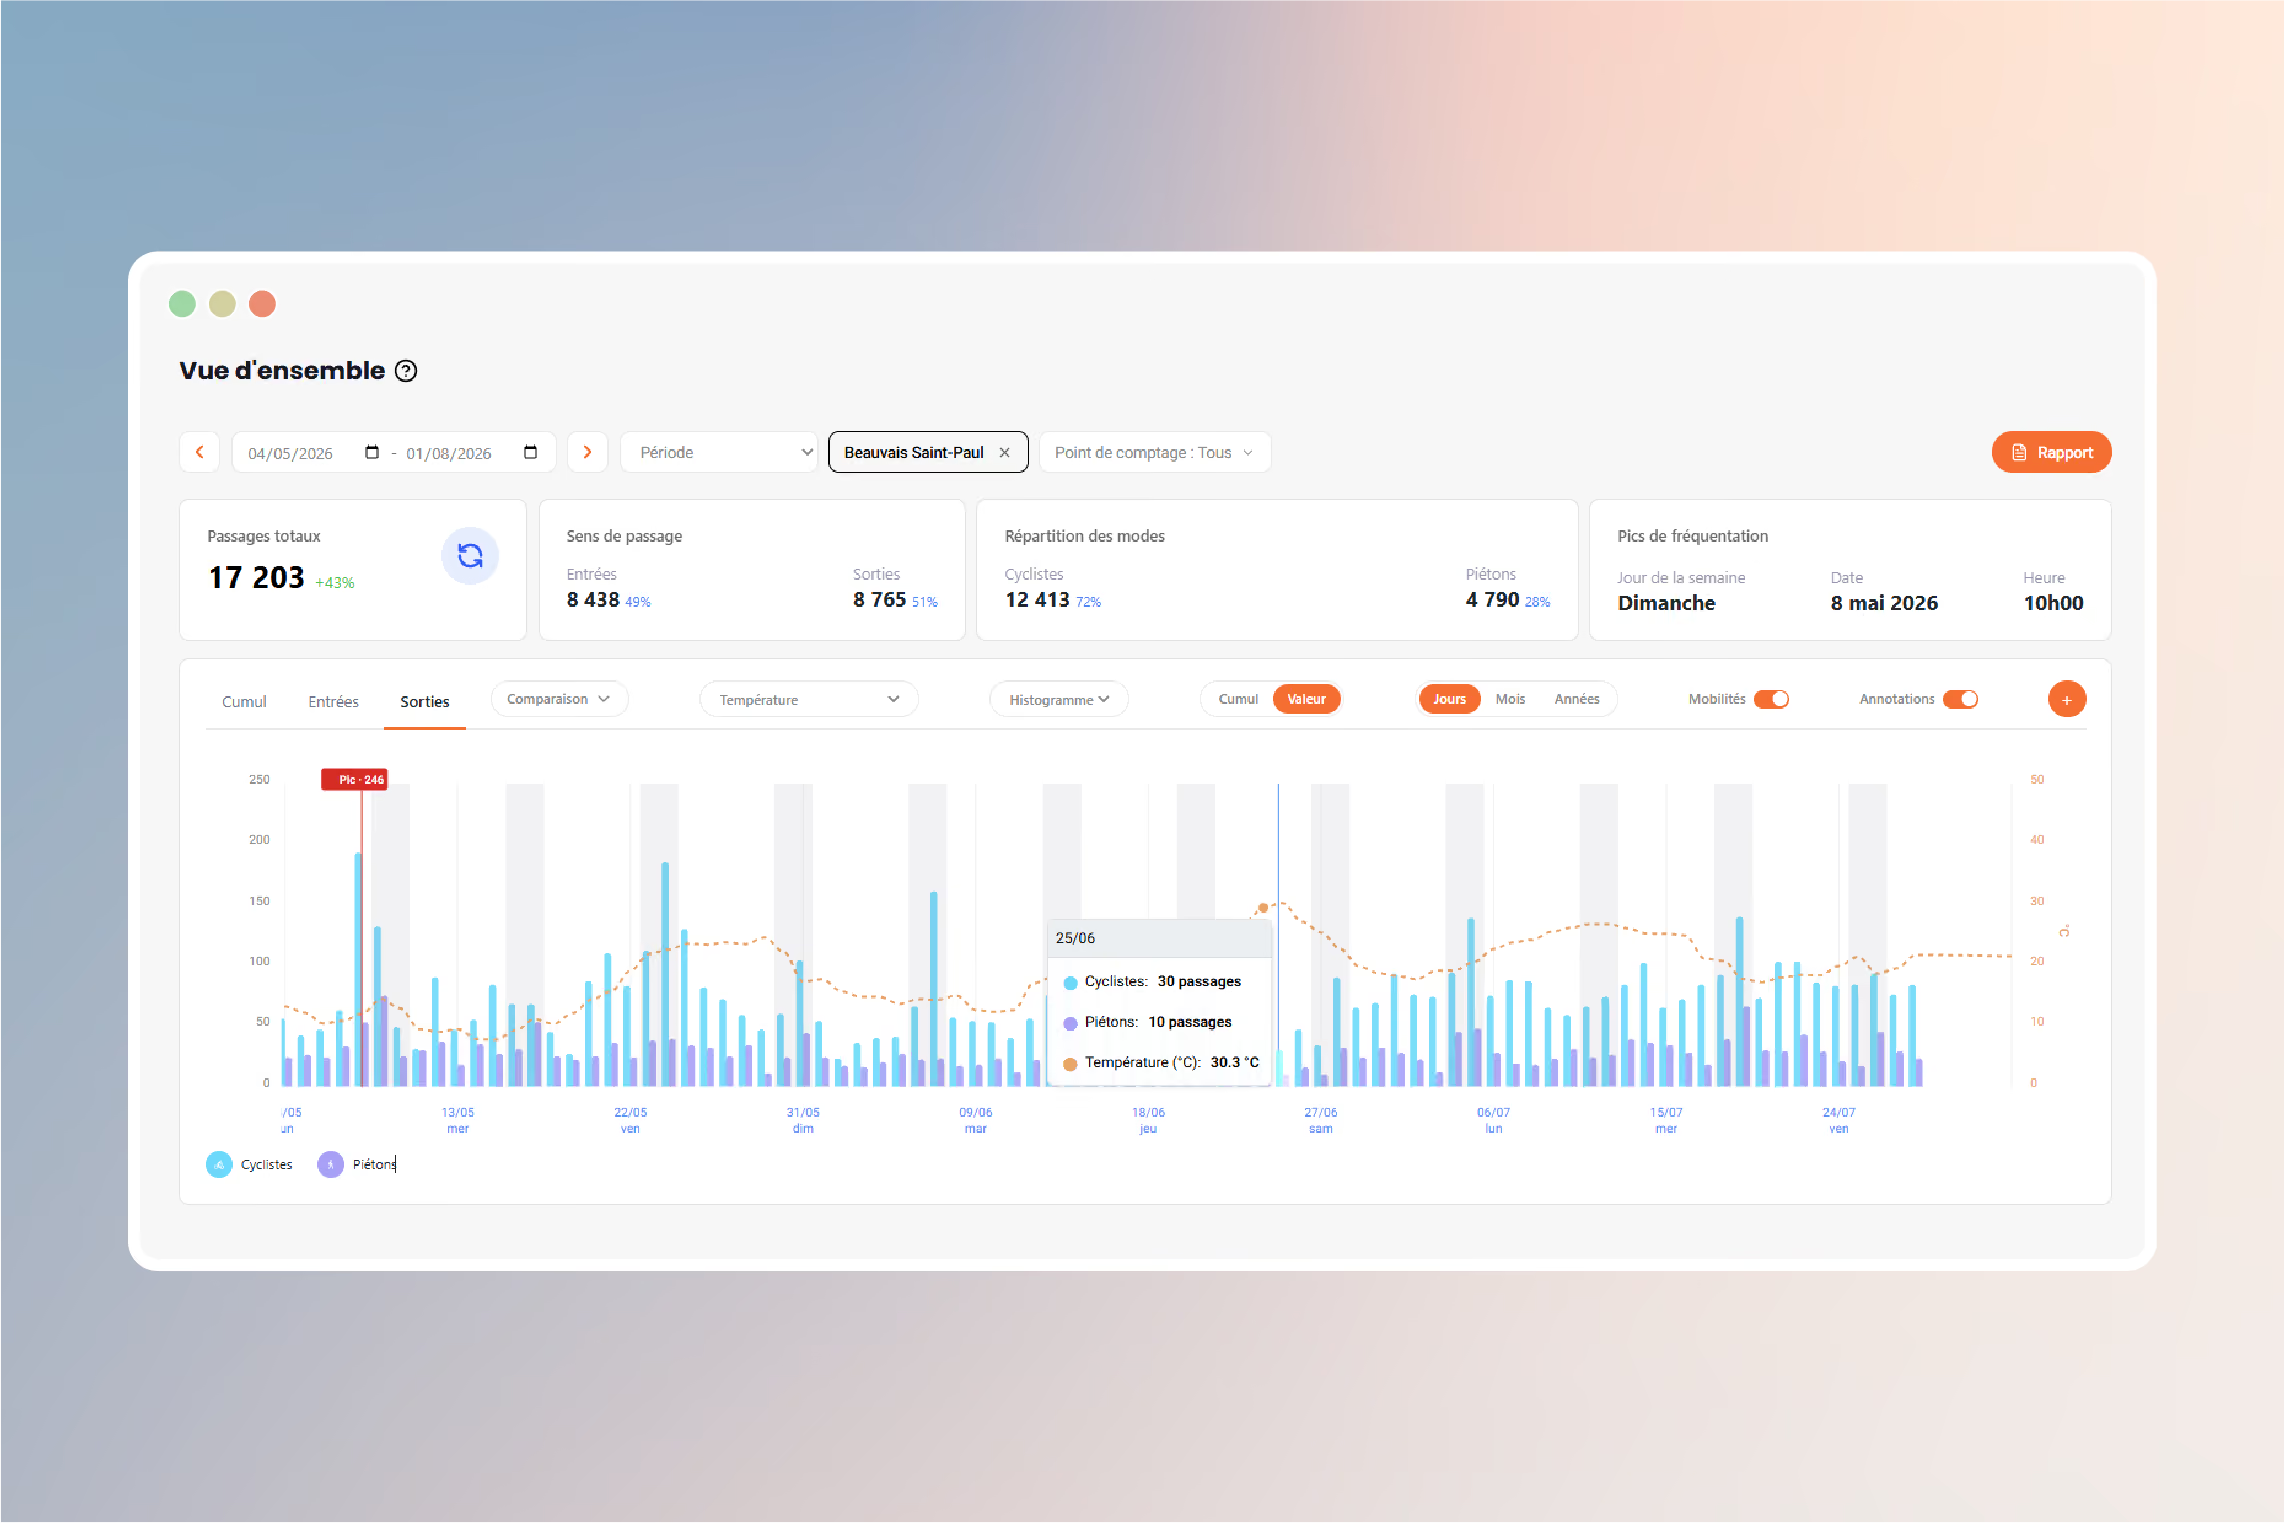
Dashboards & analytics
Each analysis automatically provides the essentials — along with an interactive chart that you can cross-reference with weather data, compare year-over-year, and filter by direction and mobility.
Mapping
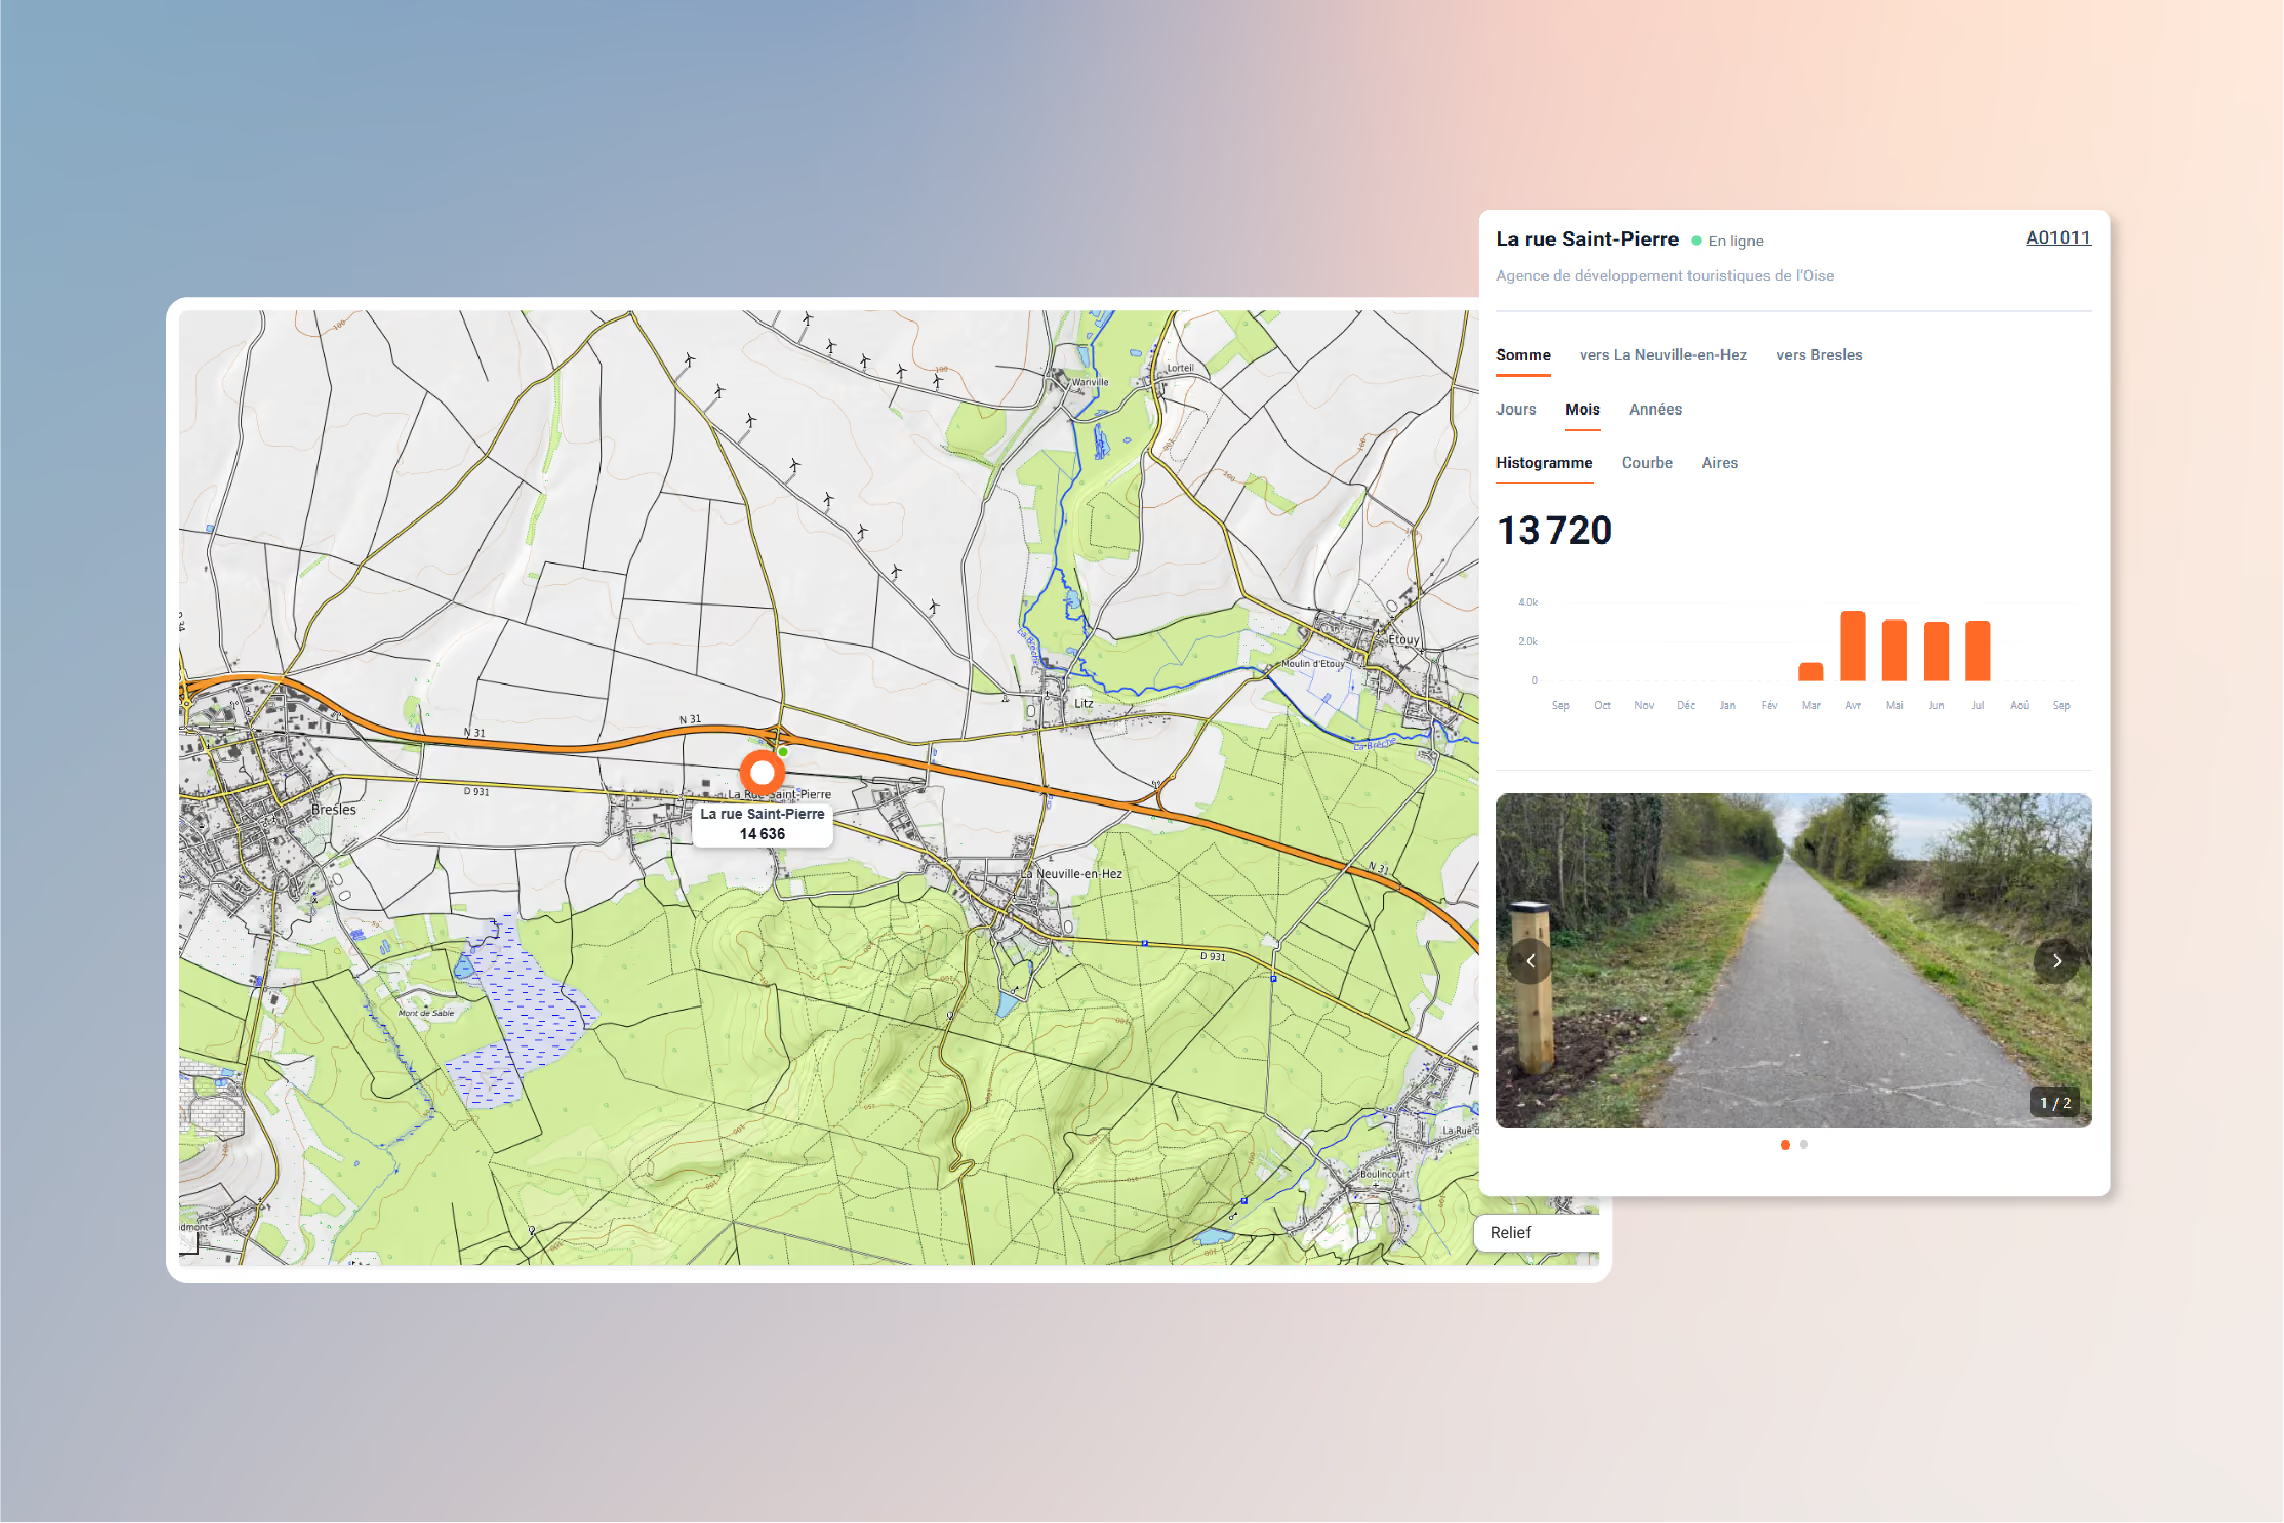
Each counting point is located on the map, with a marker sized according to traffic volume. Click to view details: trends, direction, mode share, and photos. Filter by mobility type, analysis, or time period — and choose your preferred map background.
An architecture built to last
The platform distinguishes between three objects: the counter (the hardware), the counting point (the location), and the analysis (the custom grouping of locations you choose).
Since history is linked to the location rather than the device, you can replace a faulty counter or move it to another site without ever breaking your data series.
It is also at the location level that you name the directions of travel — Entry / Exit, Upstream / Downstream, "towards the greenway" — ensuring your data remains clear and consistent over time.
From terminal to report
A workflow designed for continuity: every step protects your statistical series against field-related issues.
Each passage is detected by mobility type and direction, without images or personal data.
Encrypted transmission via cellular networks (LTE-M / NB-IoT), at least once a day, with configurable frequency.
In the event of an outage, counts are kept in the counter and retrieved once the network is restored.
The data automatically feeds your dashboards, map, and alerts.
Dead zone? No problem
Many natural sites and greenways are outside cellular coverage. A Verdilo installed in an area without network access stores its counts locally; they are then collected on-site and integrated into the platform. Your data series remain complete, wherever the counter is located.
Offline counter
Local storage
On-site collection
Kiomda Analytics
Sovereignty
Retrieve, share, and interconnect — freely and without technical dependency. The platform is designed to ensure you stay in control.
Supervision & alerts
Daily tracking displays count intensity, day by day and point by point. An empty cell stands out immediately: it’s a missing transmission that needs attention.
Training & independence
Initial training (in-person or via video call) to get you up to speed with all features, up-to-date documentation in French, and our team available for any ad-hoc support.
A 30-minute demo is all it takes to see how the platform can simplify your traffic counting management.