English
Organise visitor reception, size your teams and secure access with a clear picture of flows.


Tourist and cultural sites often combine several constraints: strong seasonality, security constraints, comfort requirements for the public, and reporting expectations on the part of supervisory authorities or partners.
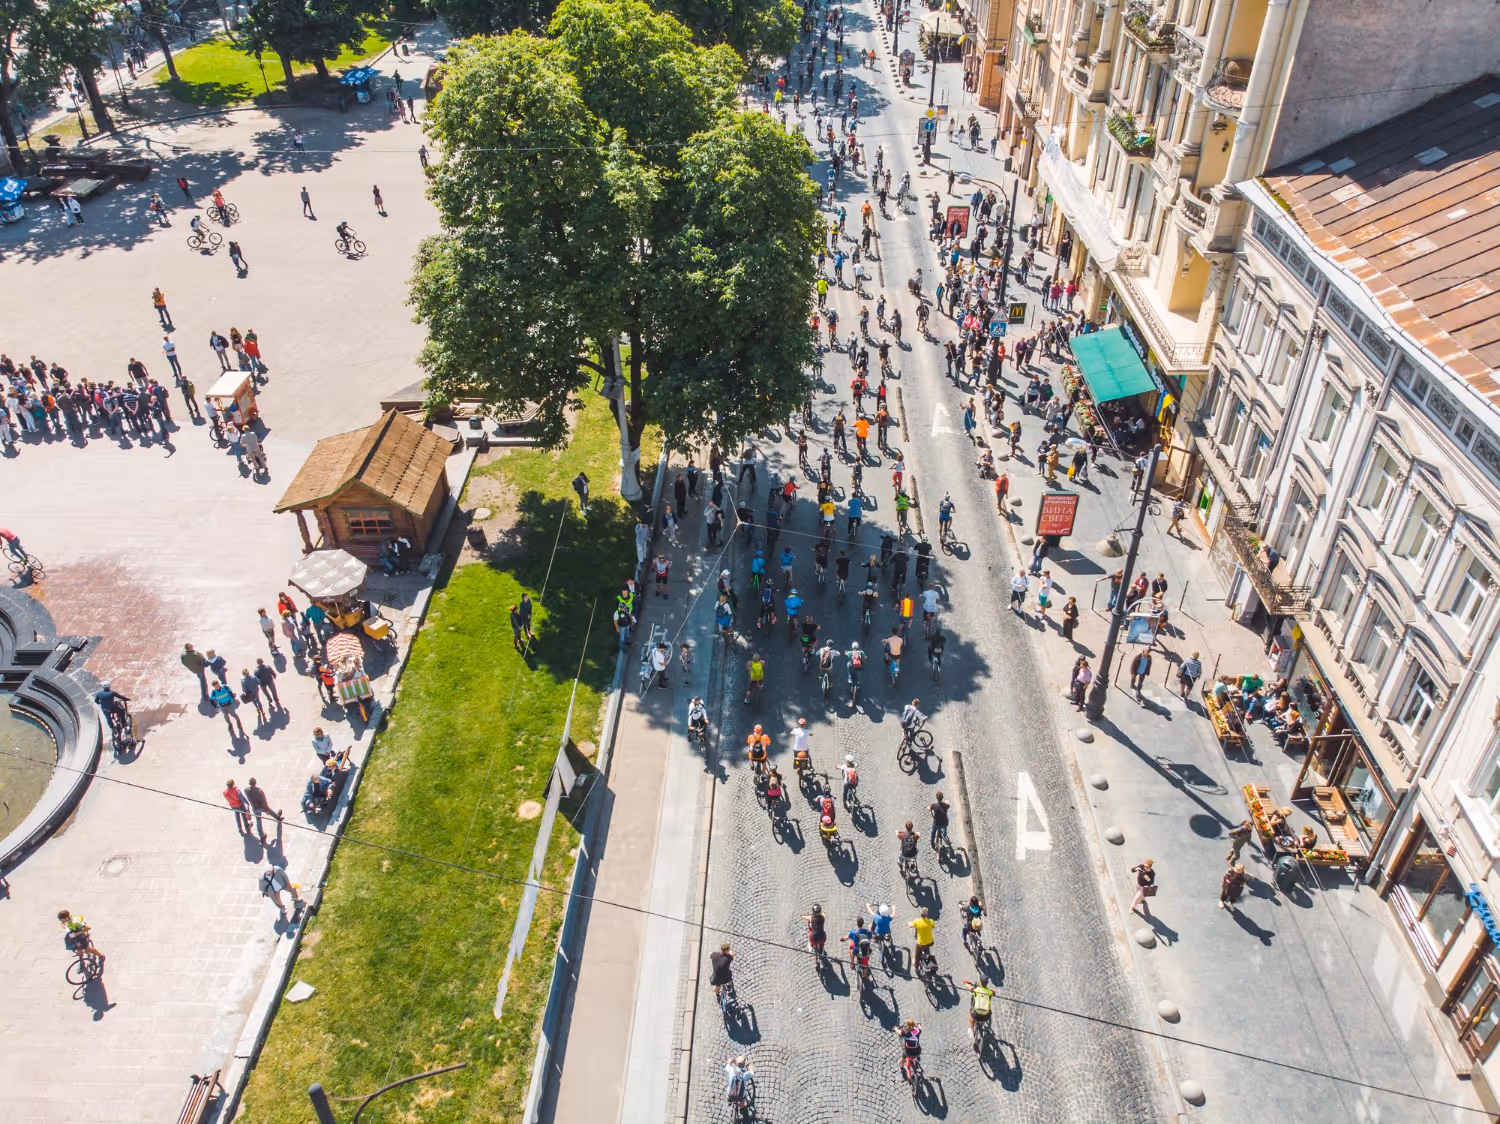
Groups, school visits, guided tours and organised excursions generate intense but short-lived peaks. Measurement reveals these arrival waves, enabling you to adjust timetables, manage queues and right-size your teams.
A site may appear to cope day-to-day while regularly operating near capacity. Data makes periods of pressure visible and supports timely adjustment decisions.
Some areas carry heavy footfall — forecourts, viewpoints, signature galleries, stairways, narrow passages — while others remain underused. Measurement identifies these imbalances and informs flow management decisions.
Temporary exhibitions, festivals, events and school holidays all shift visitor profiles throughout the year. Comparing periods helps you understand these changes and prepare more effectively for the seasons ahead.
Reception upgrades, development works, team reinforcements, pricing reviews — all require evidence. Reliable attendance indicators strengthen your case with both public authorities and private partners.
Designed for outdoor environments, without construction or wiring.
Battery-powered, no mains connection required. Estimated battery life: 2+ years.
Up and running in 2 minutes, no expertise needed, delivered ready to use.
Designed for outdoor conditions, in natural or urban environments.
No images stored, fully GDPR compliant.
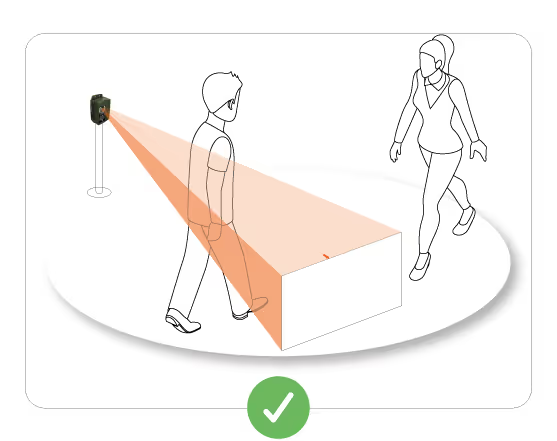
Independently identifies pedestrians, cyclists and vehicles depending on configuration.
View data online or retrieve it manually in areas without connectivity.
Thermal technology: the sensor reads the body heat of each user. The magnetometer detects the passage of metallic elements. No cameras, no images, no personal data.

Each passage is timestamped and classified by mode and direction.
Data is aggregated into 15-minute intervals directly within the device.
Depending on the chosen frequency (from 5 minutes to 24 hours), the device sends its data via the available network.
If there's no network, local Wi-Fi data collection is still possible.
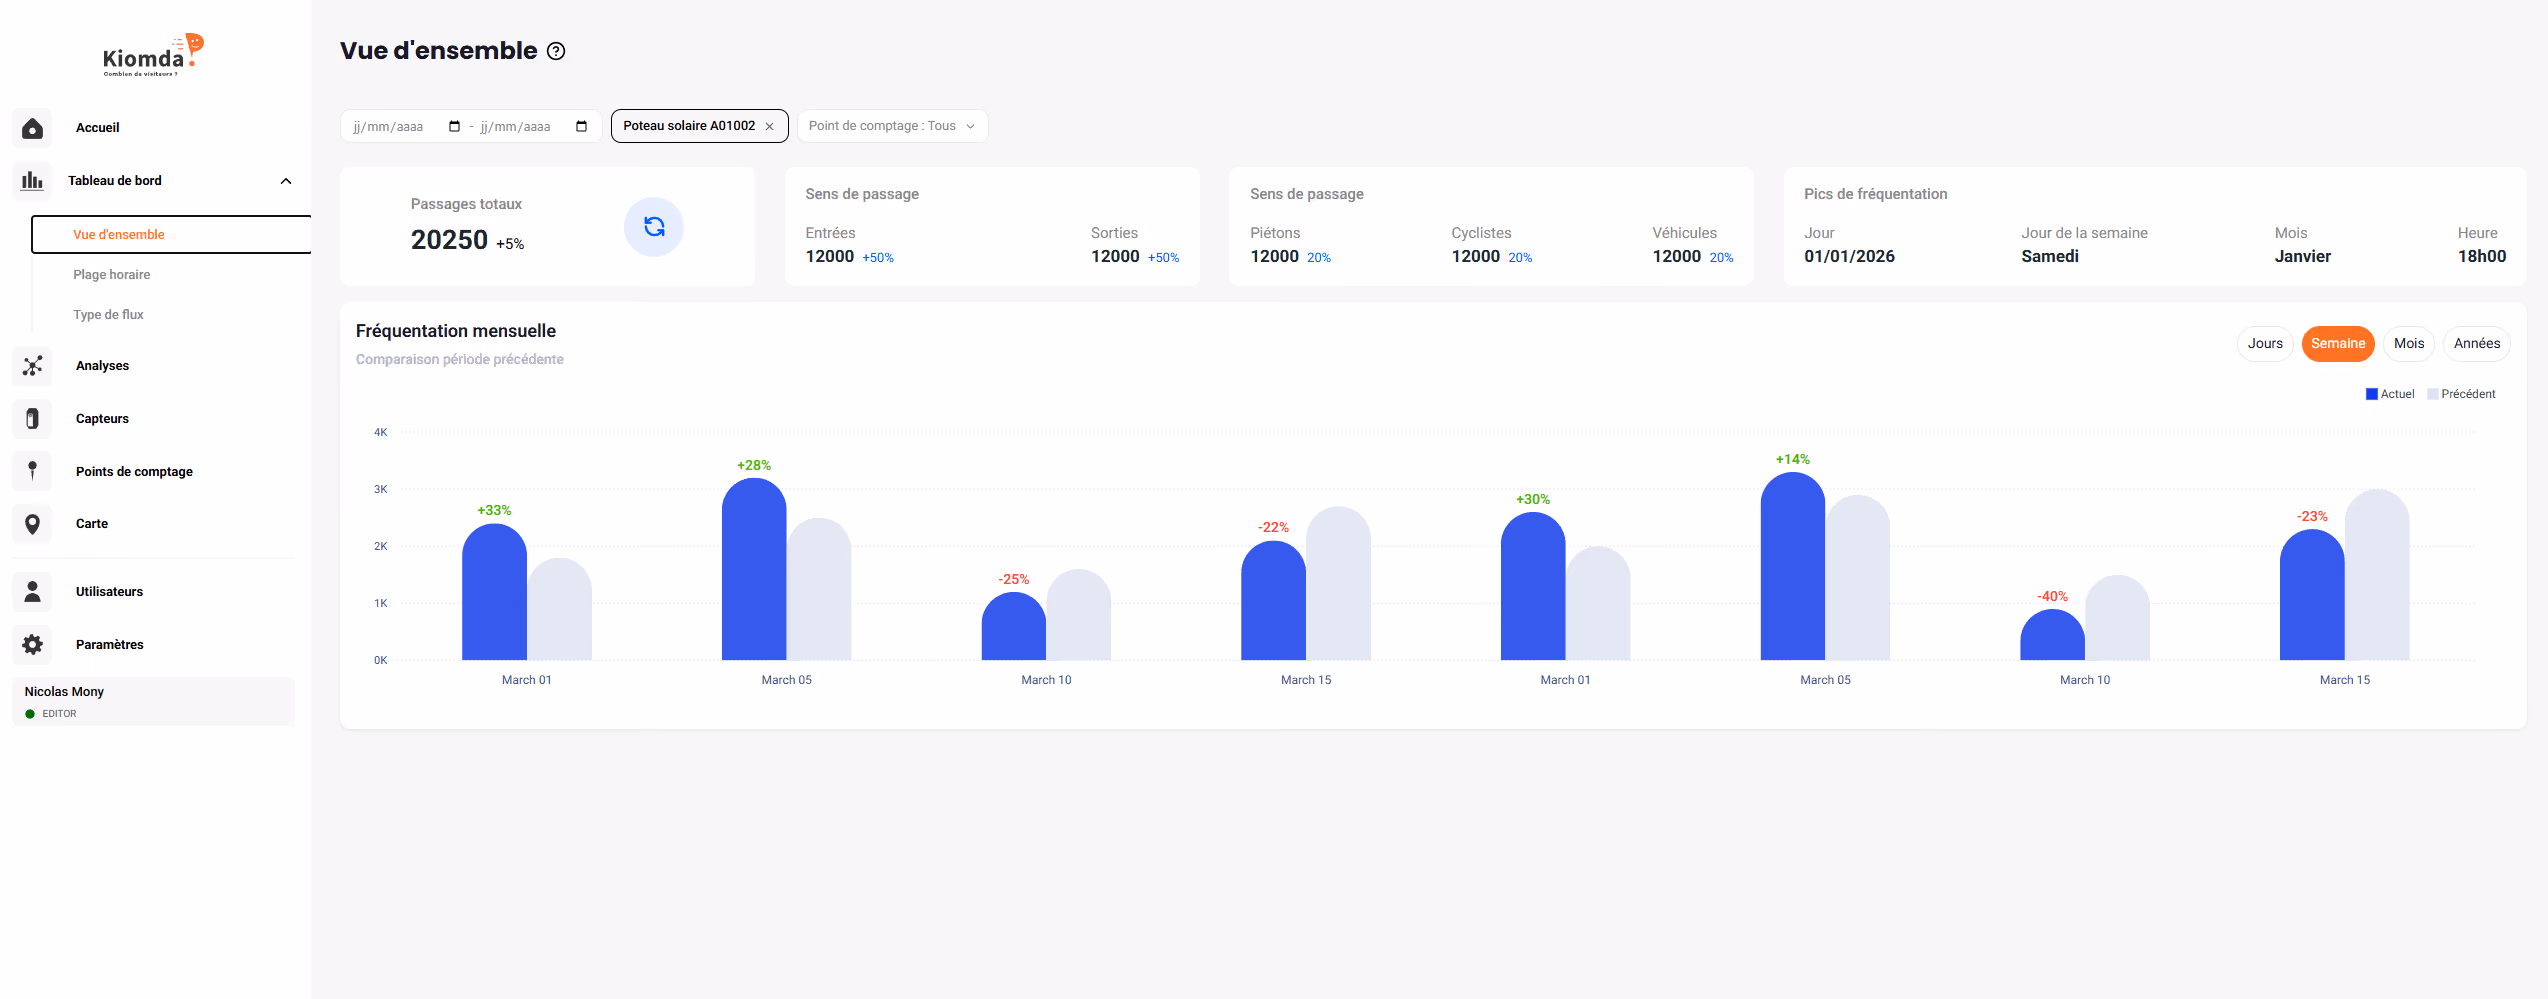
The Kiomda Report platform displays hourly curves, daily totals, and seasonal comparisons from any browser


The standard casing is weather-resistant and designed for outdoor use. Its sleek and discreet design blends naturally into urban and natural environments.


A reinforced, vandal-proof casing, perfectly suited for public areas. This model is designed to withstand all types of damage.


A birdhouse that blends into natural environments – ideal for nature reserves, parks, and protected areas.


A wooden post that completely conceals the sensor — ideal for greenways, rural paths, and heritage sites where visual impact must be minimal.

Monitoring of flows on an outdoor route, identification of seasonal peaks, adjustment of reception systems.
Measure arrivals at the entrance, support team organisation and analyse the impact of temporary exhibitions.
Monitor usage in sensitive spaces (stairs, terraces), and build the evidence base for regulatory or development decisions.
Count at a key section or strategic point to understand route usage and assess its attractiveness.
Compare footfall between standard periods and events to adjust your offering and resources accordingly.


Having regular data on inflows, outflows and internal flows makes it possible to move from intuitive management to management based on measured trends.
For a tourist or cultural site, this translates into concrete gains in readability, comfort for visitors and solidity in decisions.
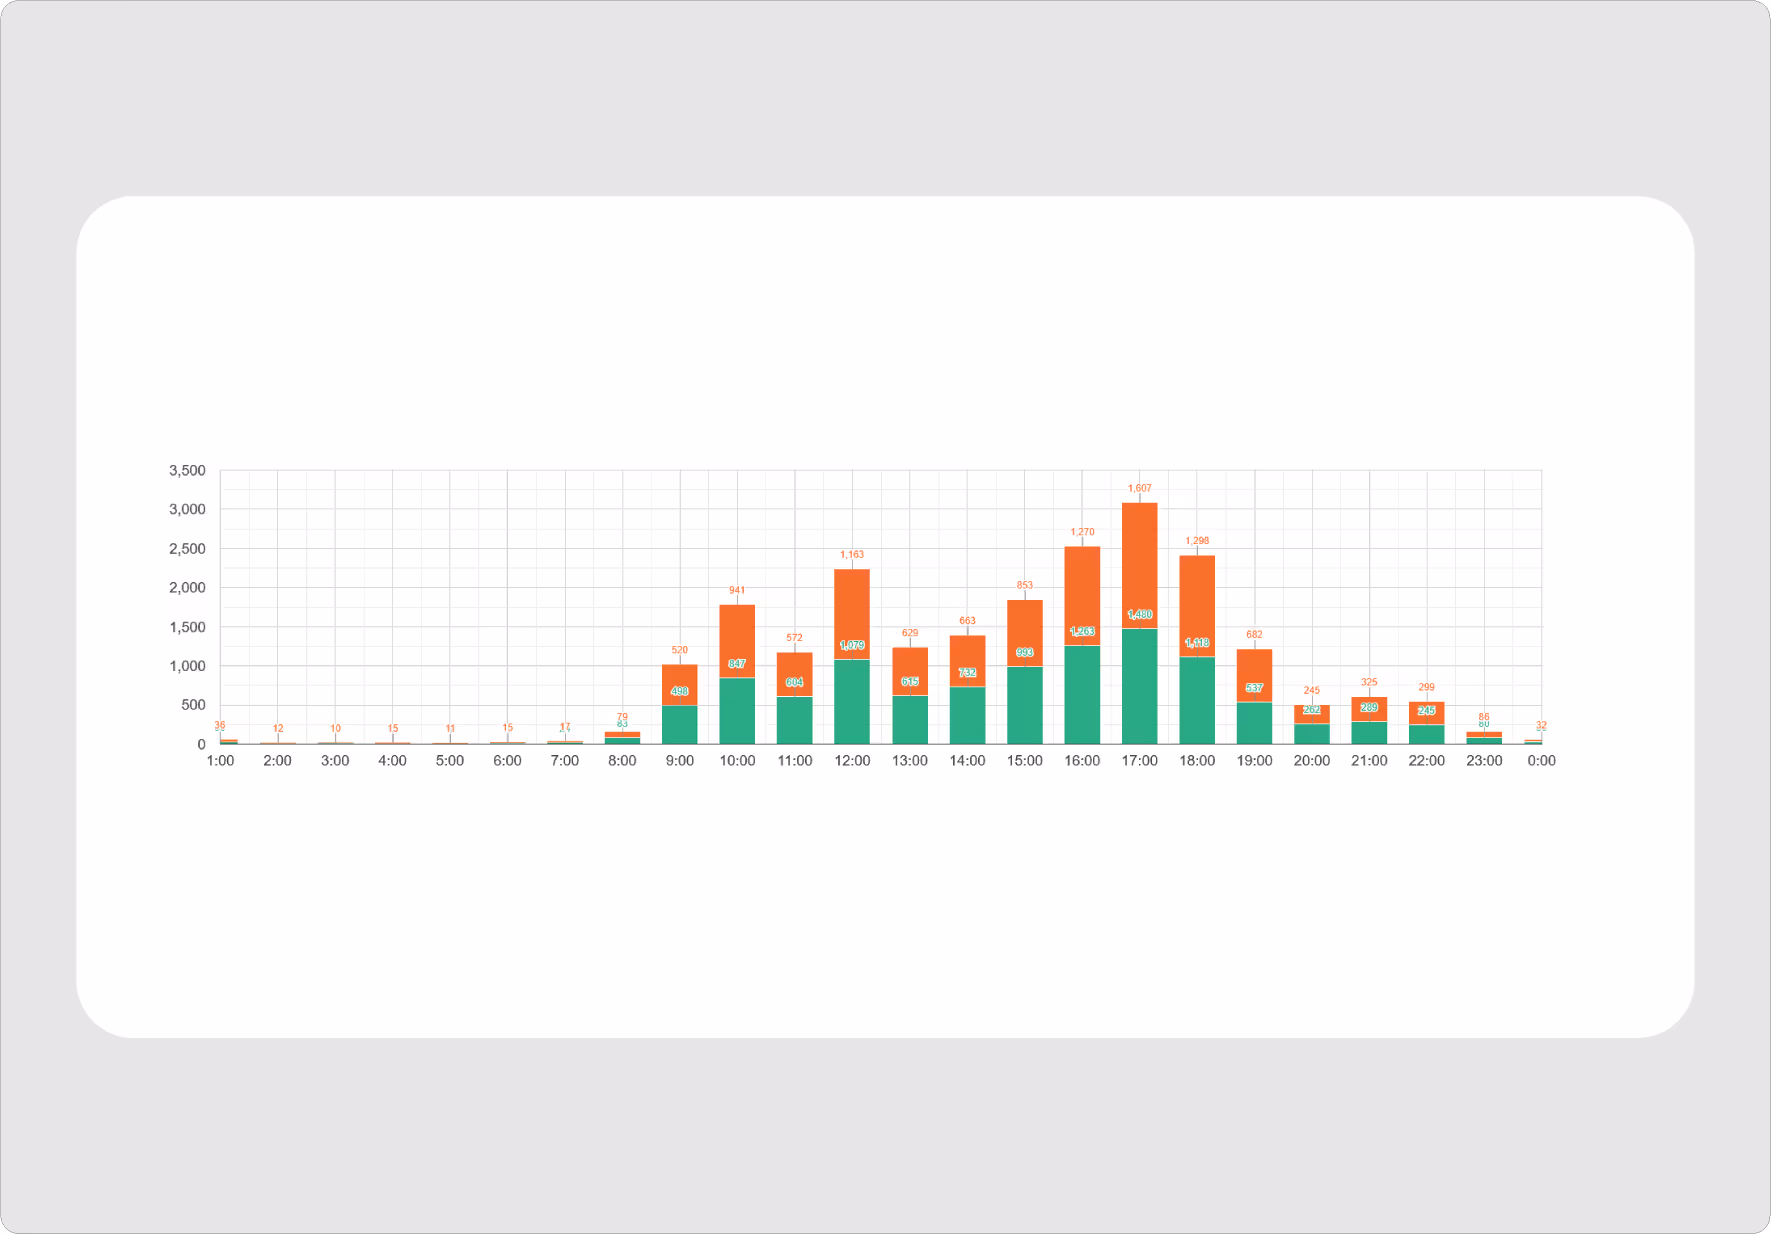
See clearly which times and days are busiest, and how seasons and events affect footfall. Plan your teams, adjust schedules, bring in reinforcements and manage queues with confidence.
Data highlights areas under pressure: entrances, corridors, stairways and pinch points. It informs signage decisions, redevelopment plans, flow regulation and route redesign.
Attendance indicators feed into your annual reports, funding applications, season reports or investment projects.
They provide a common language for dialogue with communities, tourist offices, cultural institutions or private partners.
Case Studies
Choose the solution that fits your needs
Whether you require continuous monitoring or a one-off analysis, our visitor counting solutions adapt to your projects with turnkey services.

A long-term investment to continuously equip your sites and own your attendance data.
For local authorities and site managers with ongoing monitoring needs.

A turnkey solution for testing, piloting, or measuring attendance during a one-time event, starting from €500.
Ideal for one-off events (festivals, trade shows, sports competitions), pre-purchase tests/pilots, and seasonal needs.
Submit your request online. Our team will help you design a solution tailored to your site.
We configure your sensor to your specifications and ship it ready to use — no complex setup required.
Attach the sensor to the right location: post, tree, street furniture. No wiring or external power supply needed.
The collected data is sent every 12 hours to our secure platform (frequency adjustable on request), where it is analyzed and formatted.
Access detailed statistics and use our analysis tools to optimise your infrastructure and make data-driven decisions.

Each site is different — we help you choose the easiest and most reliable configuration.


.svg)

.avif)