English
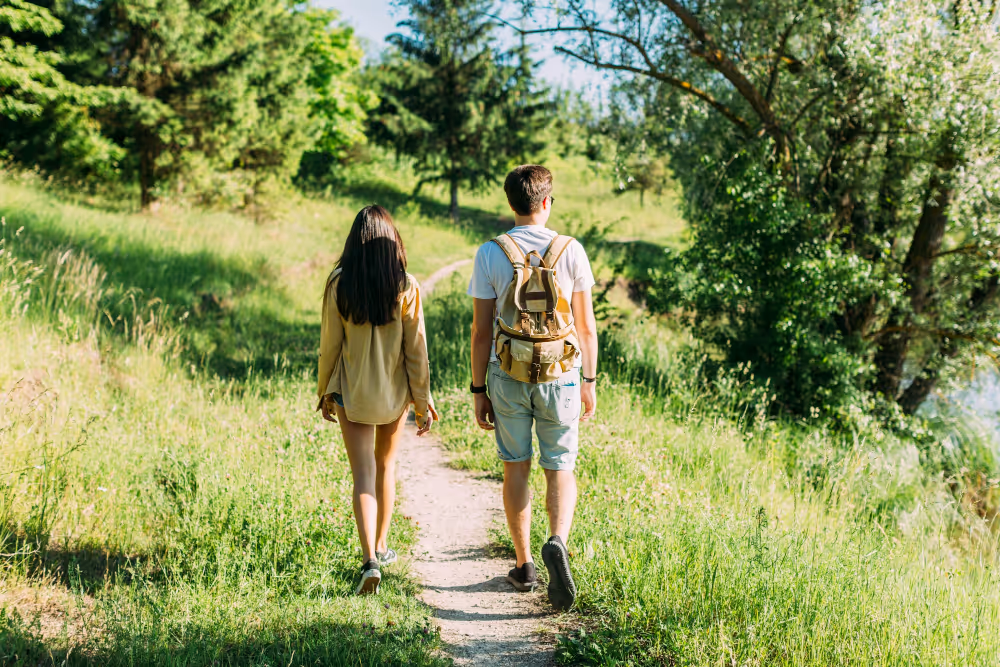
For every site with pedestrian traffic — park, public building, event, or trail. A sensor, a counting point, actionable data.
Dans la plupart des cas, oui — un point de passage naturel suffit.
Flux, pics horaires, tendances saisonnières, attractivité.
Sans travaux, sans câblage. Un point de passage suffit.


Pedestrians stop, diverge, change pace. These variations don't make measurement impossible; they make it necessary. Even in complex environments, flows produce stable and actionable trends.
In most cases, yes. You just need to identify a natural passage point: an entrance, a bottleneck, a corridor. Our job is to analyze your setup, locate this point, and adapt the sensor's positioning.
Every setup is different. The Kiomda team analyzes your passage point and recommends the most suitable solution, with no obligation.
Designed for outdoor environments, without construction or wiring.
Battery-powered, no mains connection required. Estimated battery life: 2+ years.
Up and running in 2 minutes, no expertise needed, delivered ready to use.
Designed for outdoor conditions, in natural or urban environments.
No images stored, fully GDPR compliant.
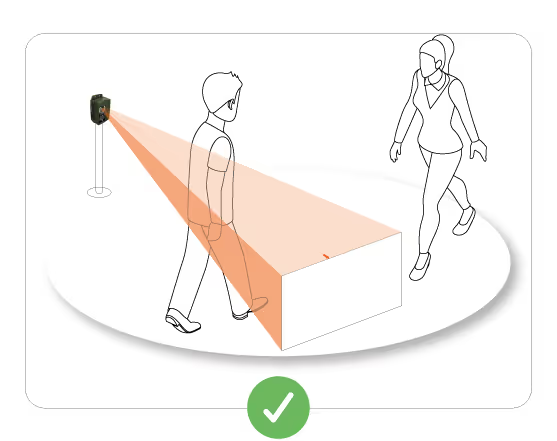
Independently identifies pedestrians, cyclists and vehicles depending on configuration.
View data online or retrieve it manually in areas without connectivity.
Thermal technology: the sensor reads the body heat of each user. No cameras, no images, no personal data.

Each passage is timestamped and classified by mode and direction.
Data is aggregated into 15-minute intervals directly within the device.
Depending on the chosen frequency (from 5 minutes to 24 hours), the device sends its data via the available network.
If there's no network, local Wi-Fi data collection is still possible.
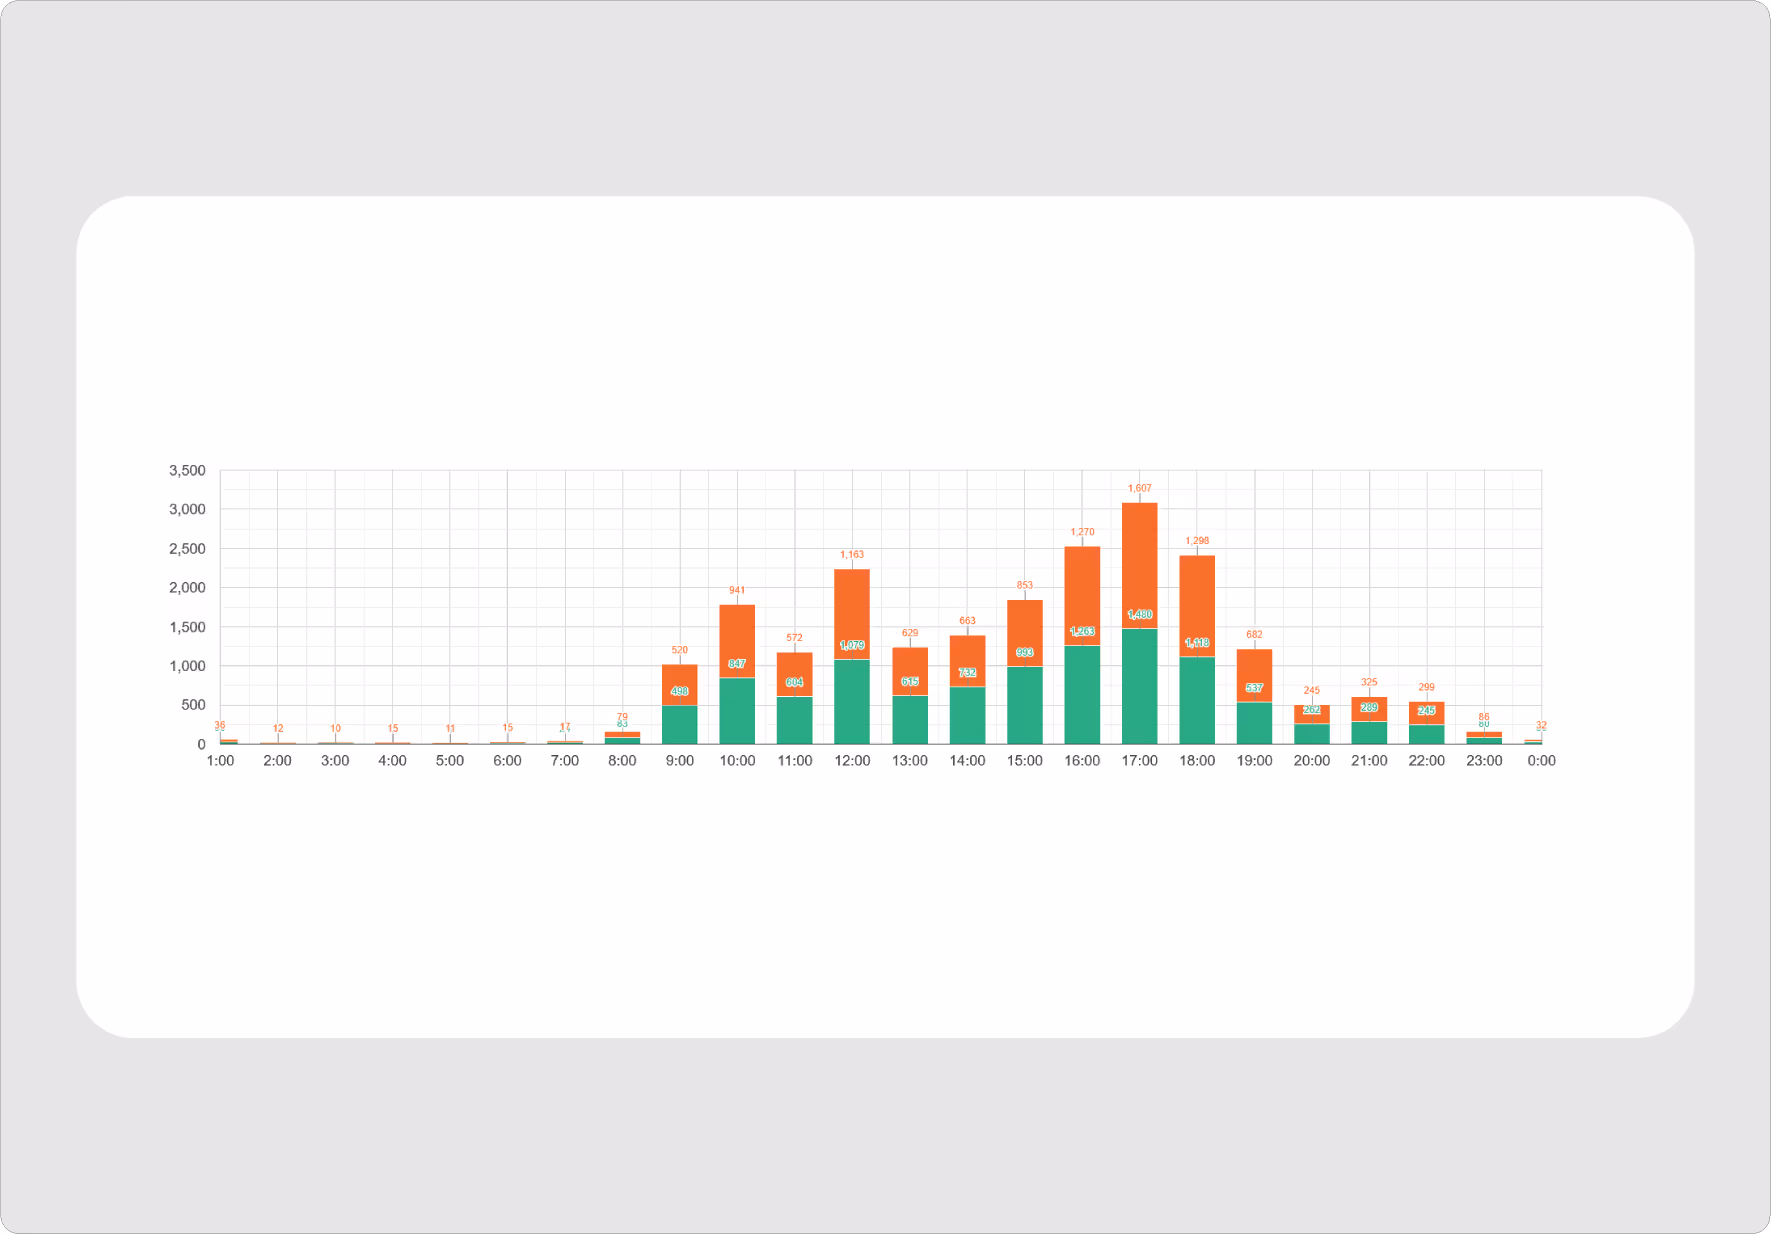
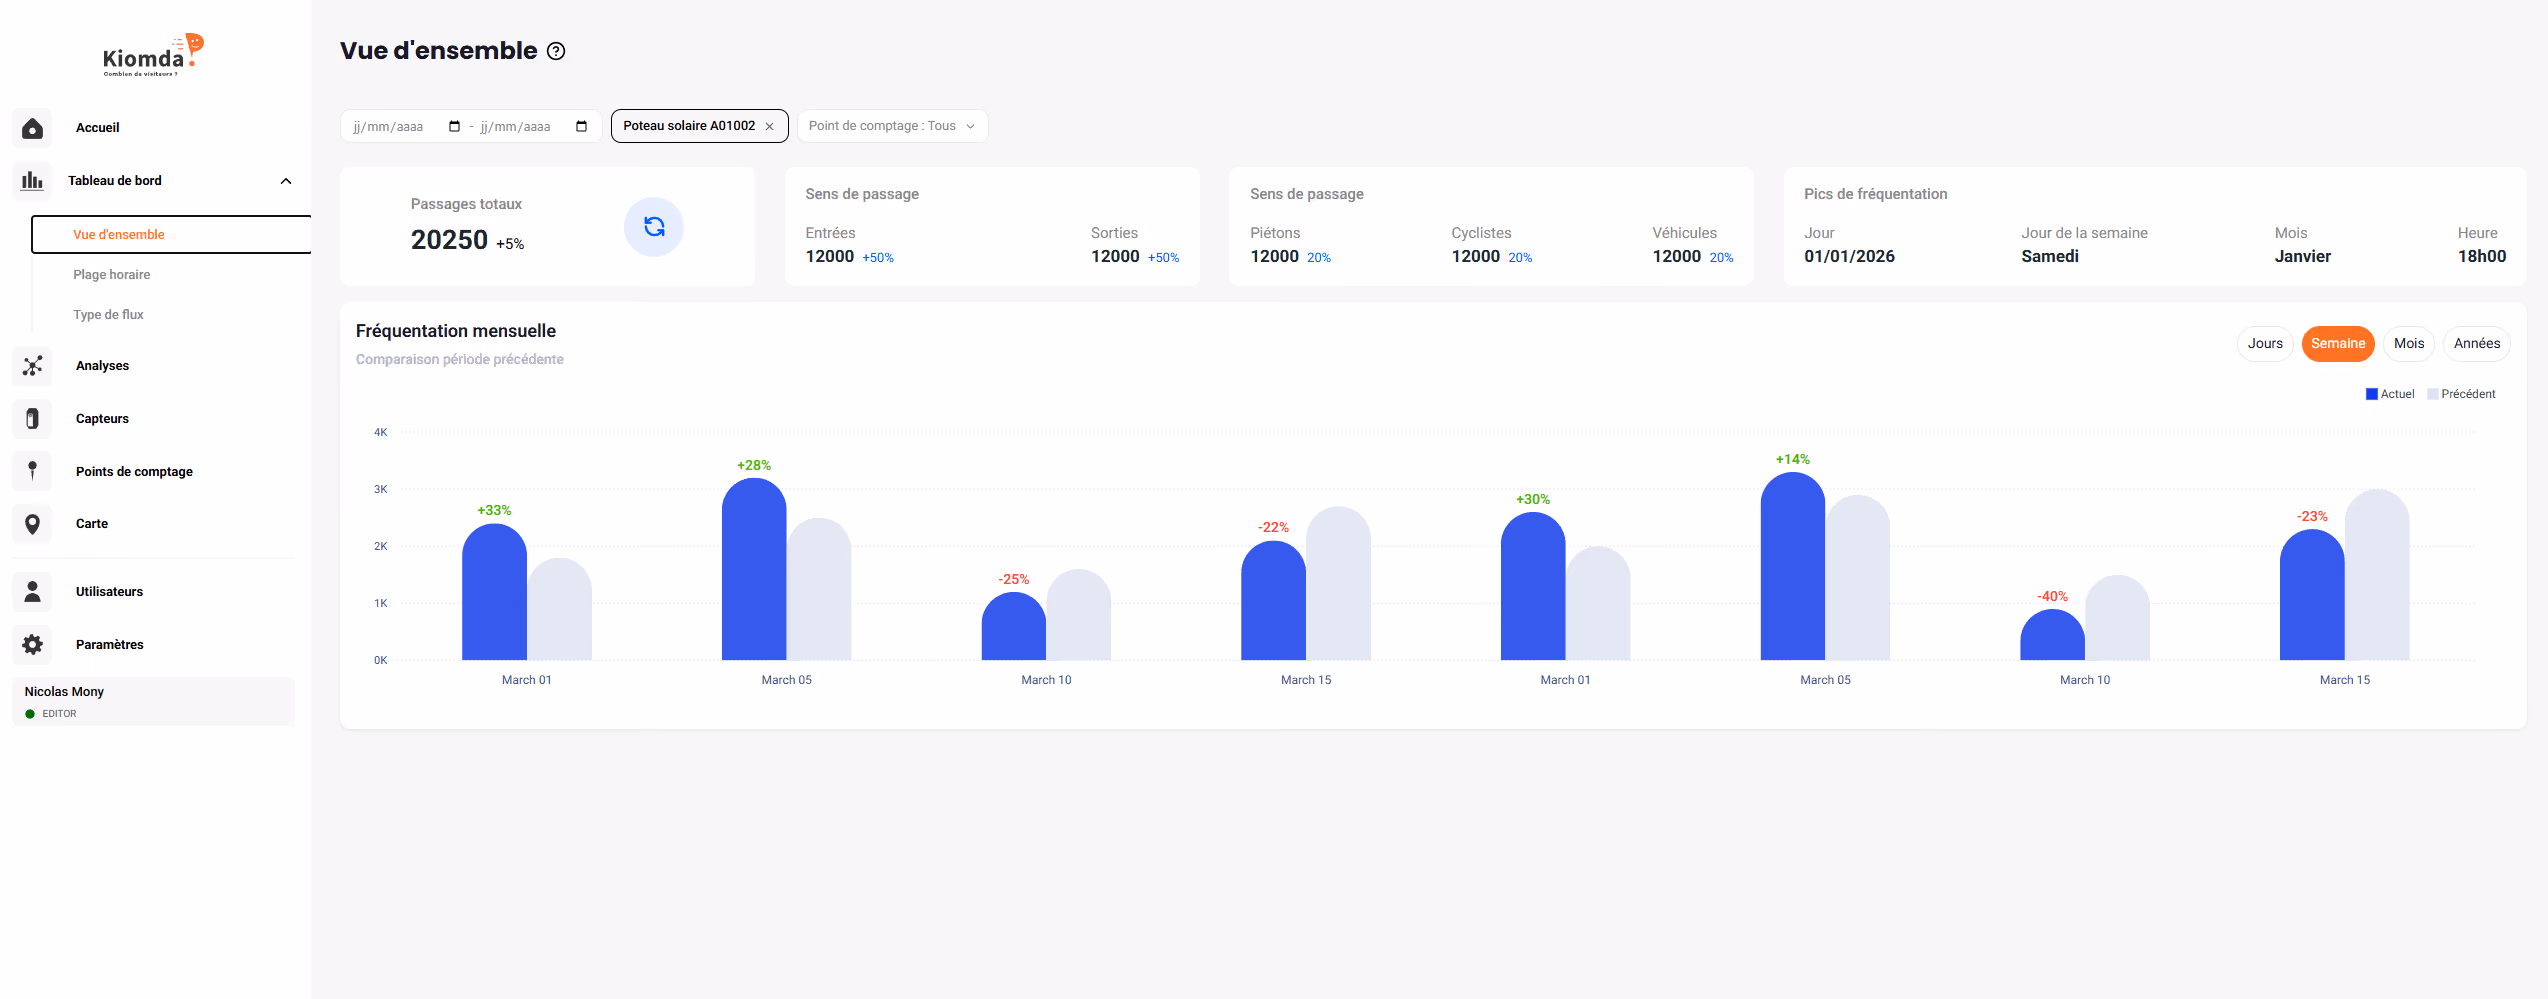
The Kiomda Report platform displays hourly curves, daily totals, and seasonal comparisons from any browser


The standard casing is weather-resistant and designed for outdoor use. Its sleek and discreet design blends naturally into urban and natural environments.


A reinforced, vandal-proof casing, perfectly suited for public areas. This model is designed to withstand all types of damage.


A birdhouse that blends into natural environments – ideal for nature reserves, parks, and protected areas.


A wooden post that completely conceals the sensor — ideal for greenways, rural paths, and heritage sites where visual impact must be minimal.

The aim of measurement is never to “make a number.” It is used to support concrete decisions.
Operational decisions based on real usage
Data to justify and build the case for projects
See what the eye cannot
Case Studies
Each site is different — we help you choose the easiest and most reliable configuration.


.svg)