English
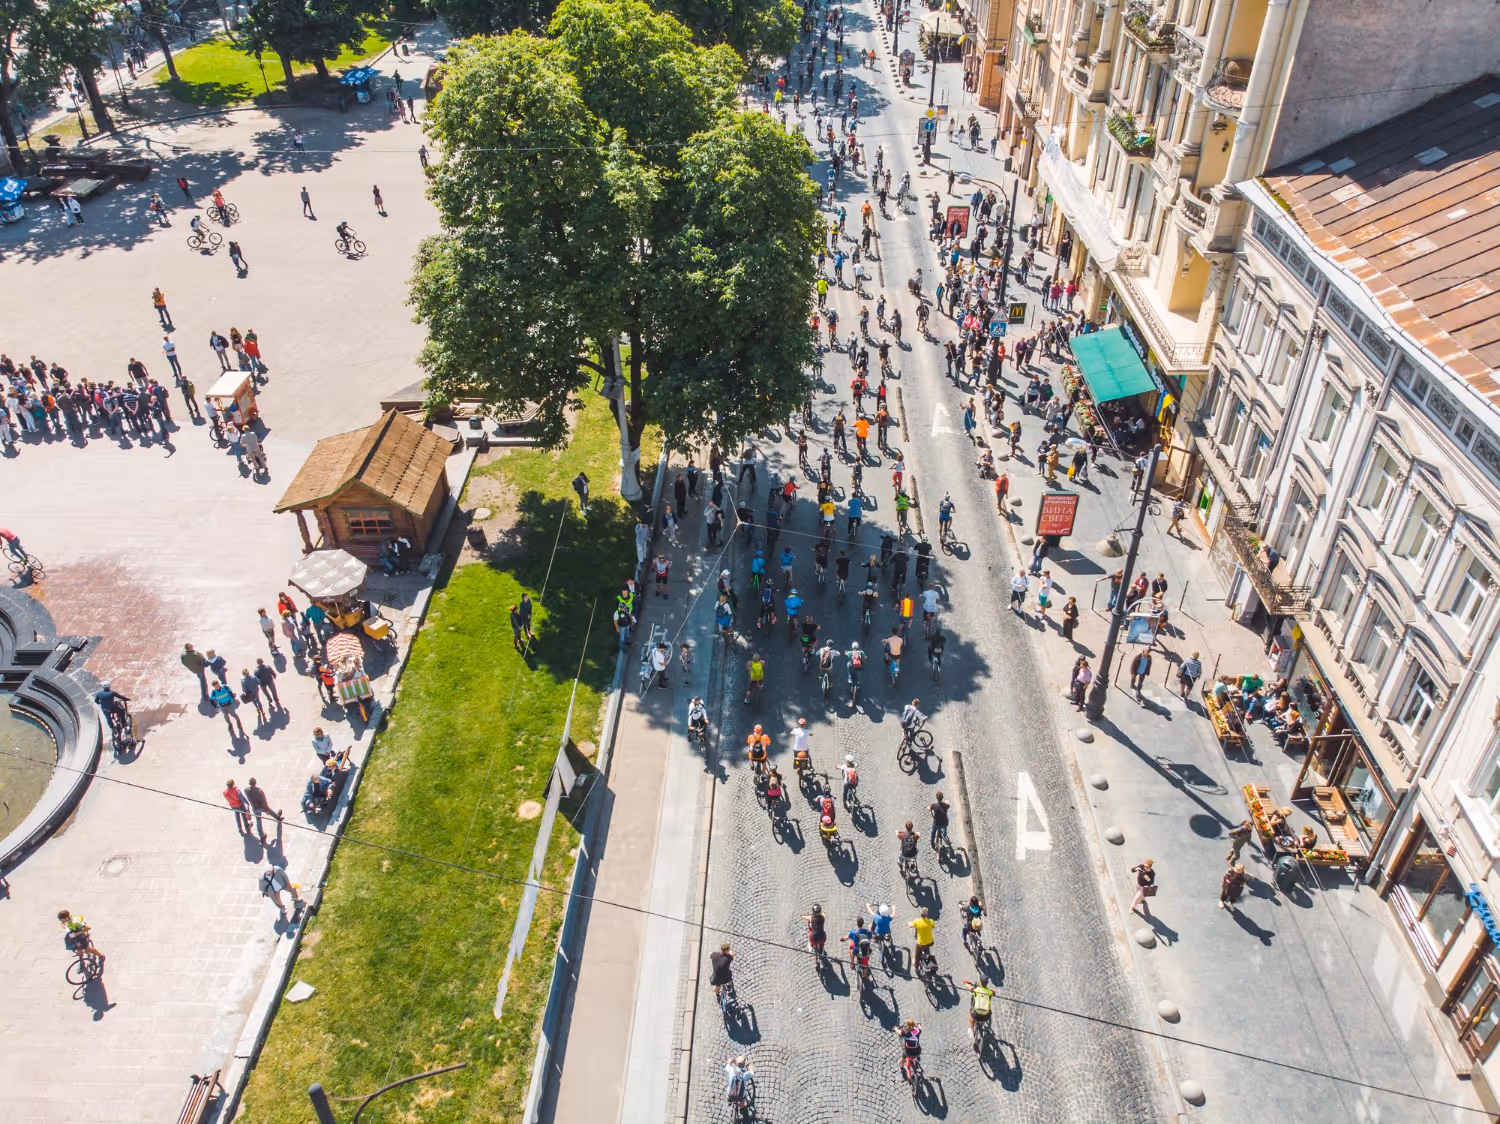
Every cycling facility raises its own questions: actual corridor usage, intersection safety, greenway attractiveness, or intermodal connections with rail stations and schools. The examples below show how a wireless cycling counter can answer these questions across a wide range of real-world contexts.
In most cases, yes — a natural passage point is sufficient.
Traffic flow, hourly peaks, seasonal trends, attractiveness.
No installation, no wiring. A single passage point is sufficient.


Technologies
Designed for outdoor environments, no installation or wiring required.
Operates without external power (estimated battery life of over 2 ).
Set up in 2 minutes, no expertise required, delivered ready to use.
Designed for outdoor conditions, in natural or urban environments.
No images recorded, GDPR compliant.
Capable of separately identifying pedestrians, cyclists, and vehicles, depending on the selected counting type.
Online consultation or local data collection in isolated areas.


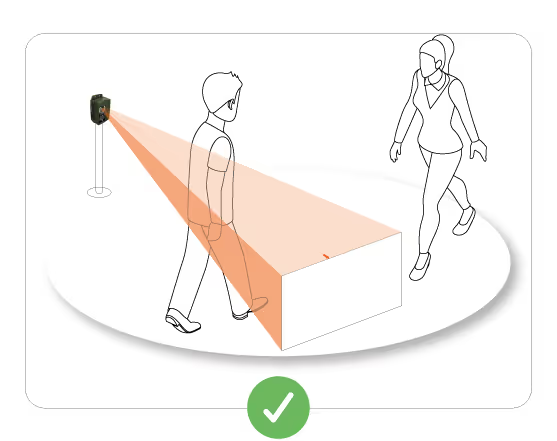
Thermal technology: the sensor reads each user's body heat. No camera, no images, no personal data.

Each passage is timestamped and classified by mode and direction. Data is aggregated into 15-minute intervals directly within the device.
Depending on the chosen frequency (from 5 min to 24 h), the device sends its data via the available network. If there's no network, local Wi-Fi data collection is still possible.
The Kiomda Report platform displays hourly charts, daily totals, and seasonal comparisons from any browser.


The standard casing is weather-resistant and designed for outdoor use. Its sleek and discreet shape blends naturally into urban and natural environments.


A reinforced, vandal-proof casing, perfectly suited for areas with high public traffic. This model is designed to withstand all types of damage.

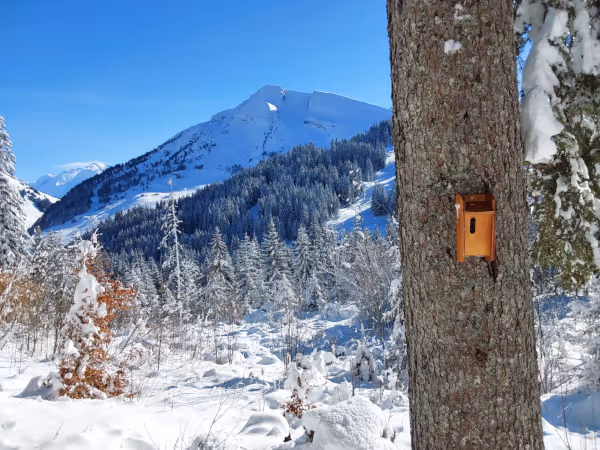
A birdhouse that blends into natural environments – ideal for nature reserves, parks, and protected areas.


A wooden post that completely conceals the sensor — ideal for greenways, rural paths, and heritage sites where visual impact must be minimal.
For structured bicycle facilities and busy roads, Spirilo is based on a technology of buried electromagnetic loops, directly integrated into the roadway.
Each user pass generates a disturbance in the electromagnetic field, analyzed by the system to produce a reliable count, even in dense traffic.
Unlike above-ground sensors, this approach allows measurement without obscuration: cyclists can follow each other closely without degrading the quality of the data.
The specific geometry of the loop also allows for a more detailed analysis of uses, with the possibility of distinguishing bikes from scooters.
Electromagnetic detection provides stable measurements, independent of external conditions (light, weather, ambient temperature).
The loops are directly integrated into the road surface, with no visual impact or surface installation constraints.
No electrical connection required, runs on a long-life battery.
The system can be connected to existing loops, allowing for the modernization of a setup without extensive intervention.
The electromagnetic signature makes it possible to qualify flows and distinguish between different types of users.

On a narrow road where cyclists travel in both directions, two successive loops allow the direction of passage to be reconstructed.

On a one-way track, one or two loops make it possible to measure a homogeneous and continuous flow, with great precision.

On a wide or separate track, loops positioned side by side and then downstream make it possible to clearly distinguish the two directions of traffic, even in case of heavy traffic.

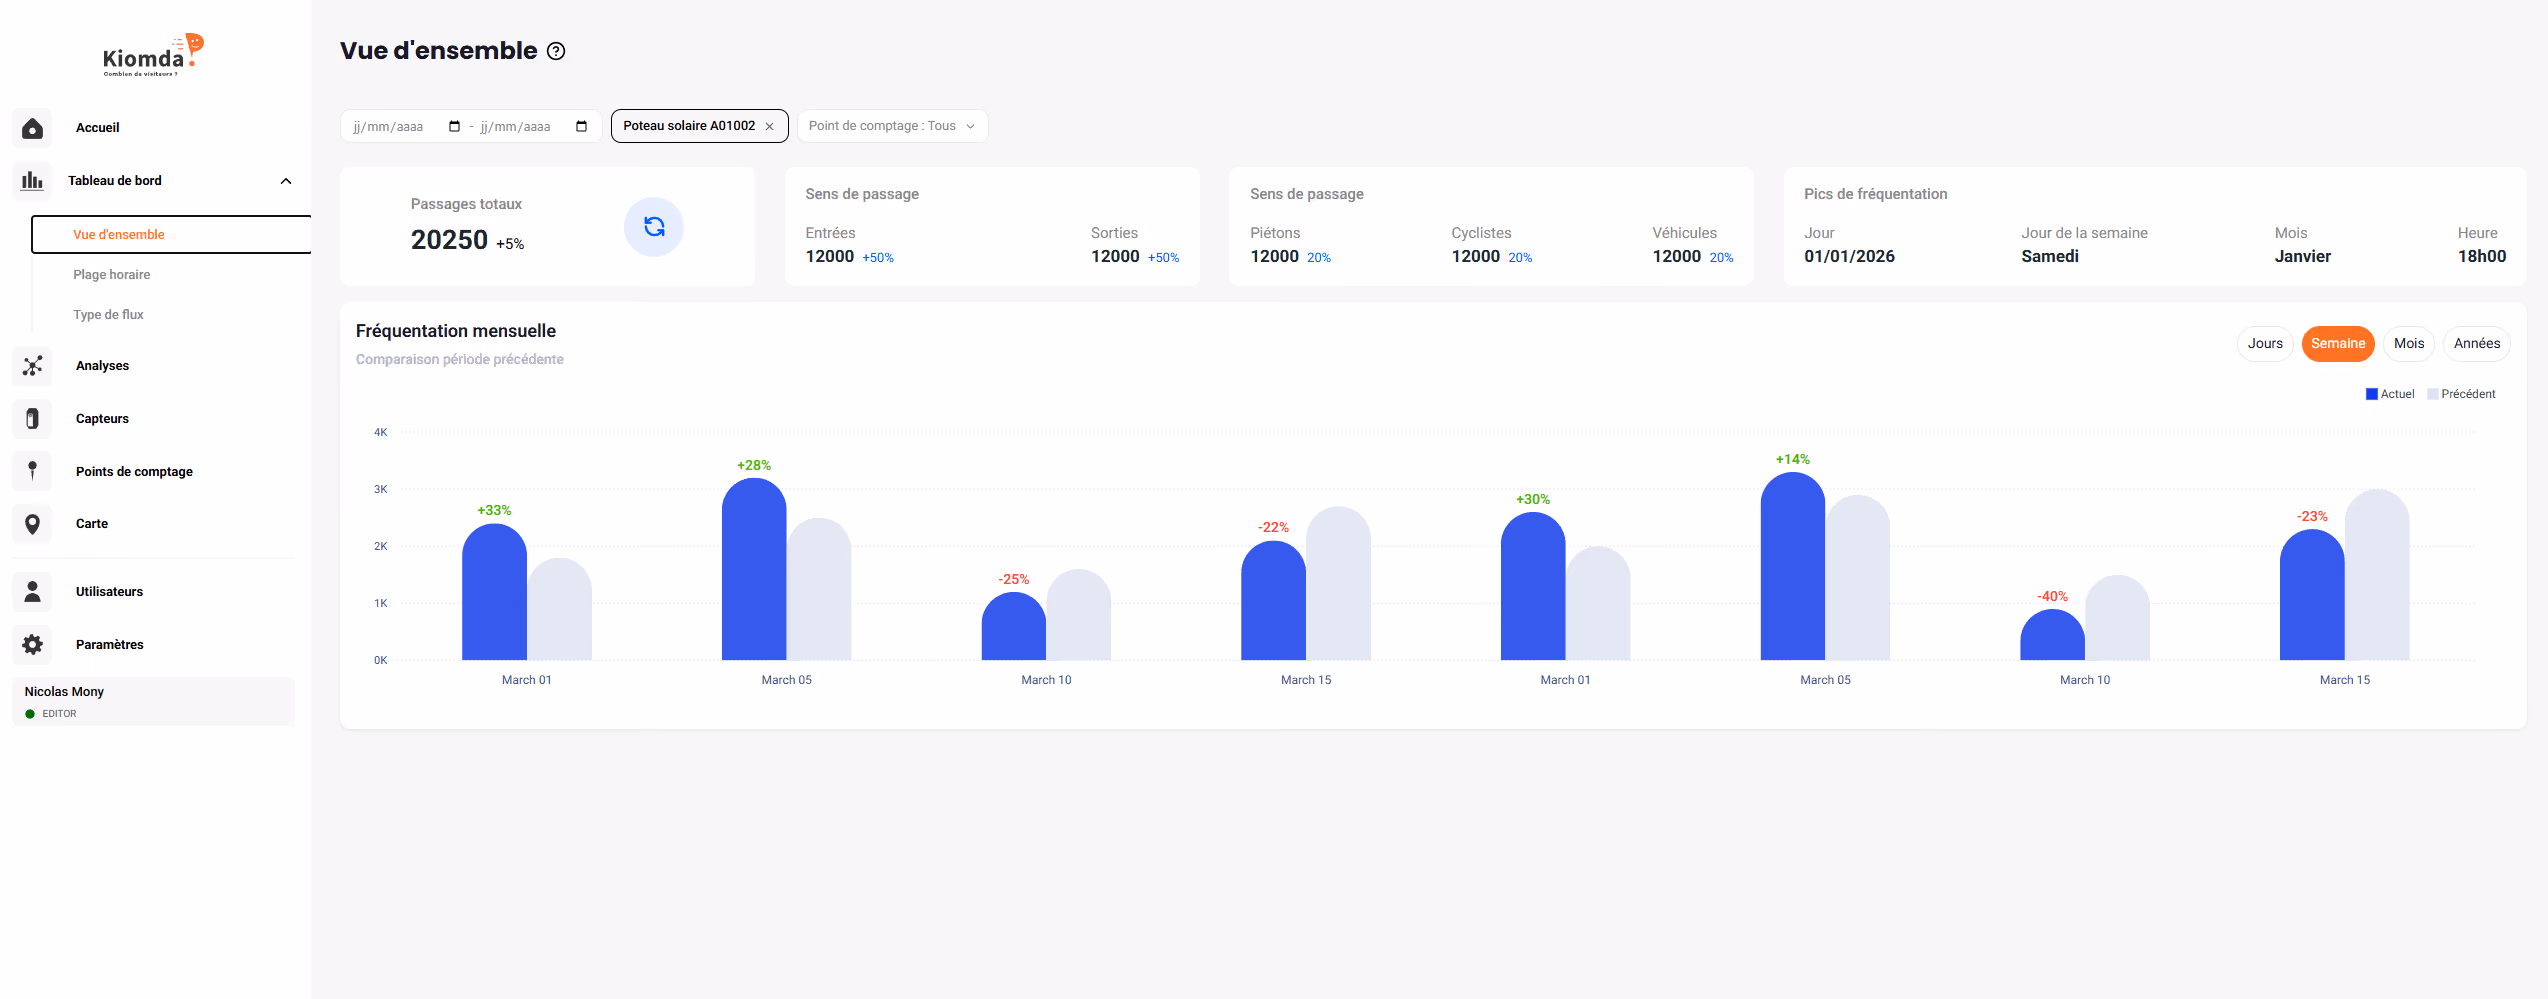
Cyclist flow measurement provides direct indicators that help understand how a route is actually used — and how it may evolve. These insights quickly become levers to organise, secure and improve the cycling network.
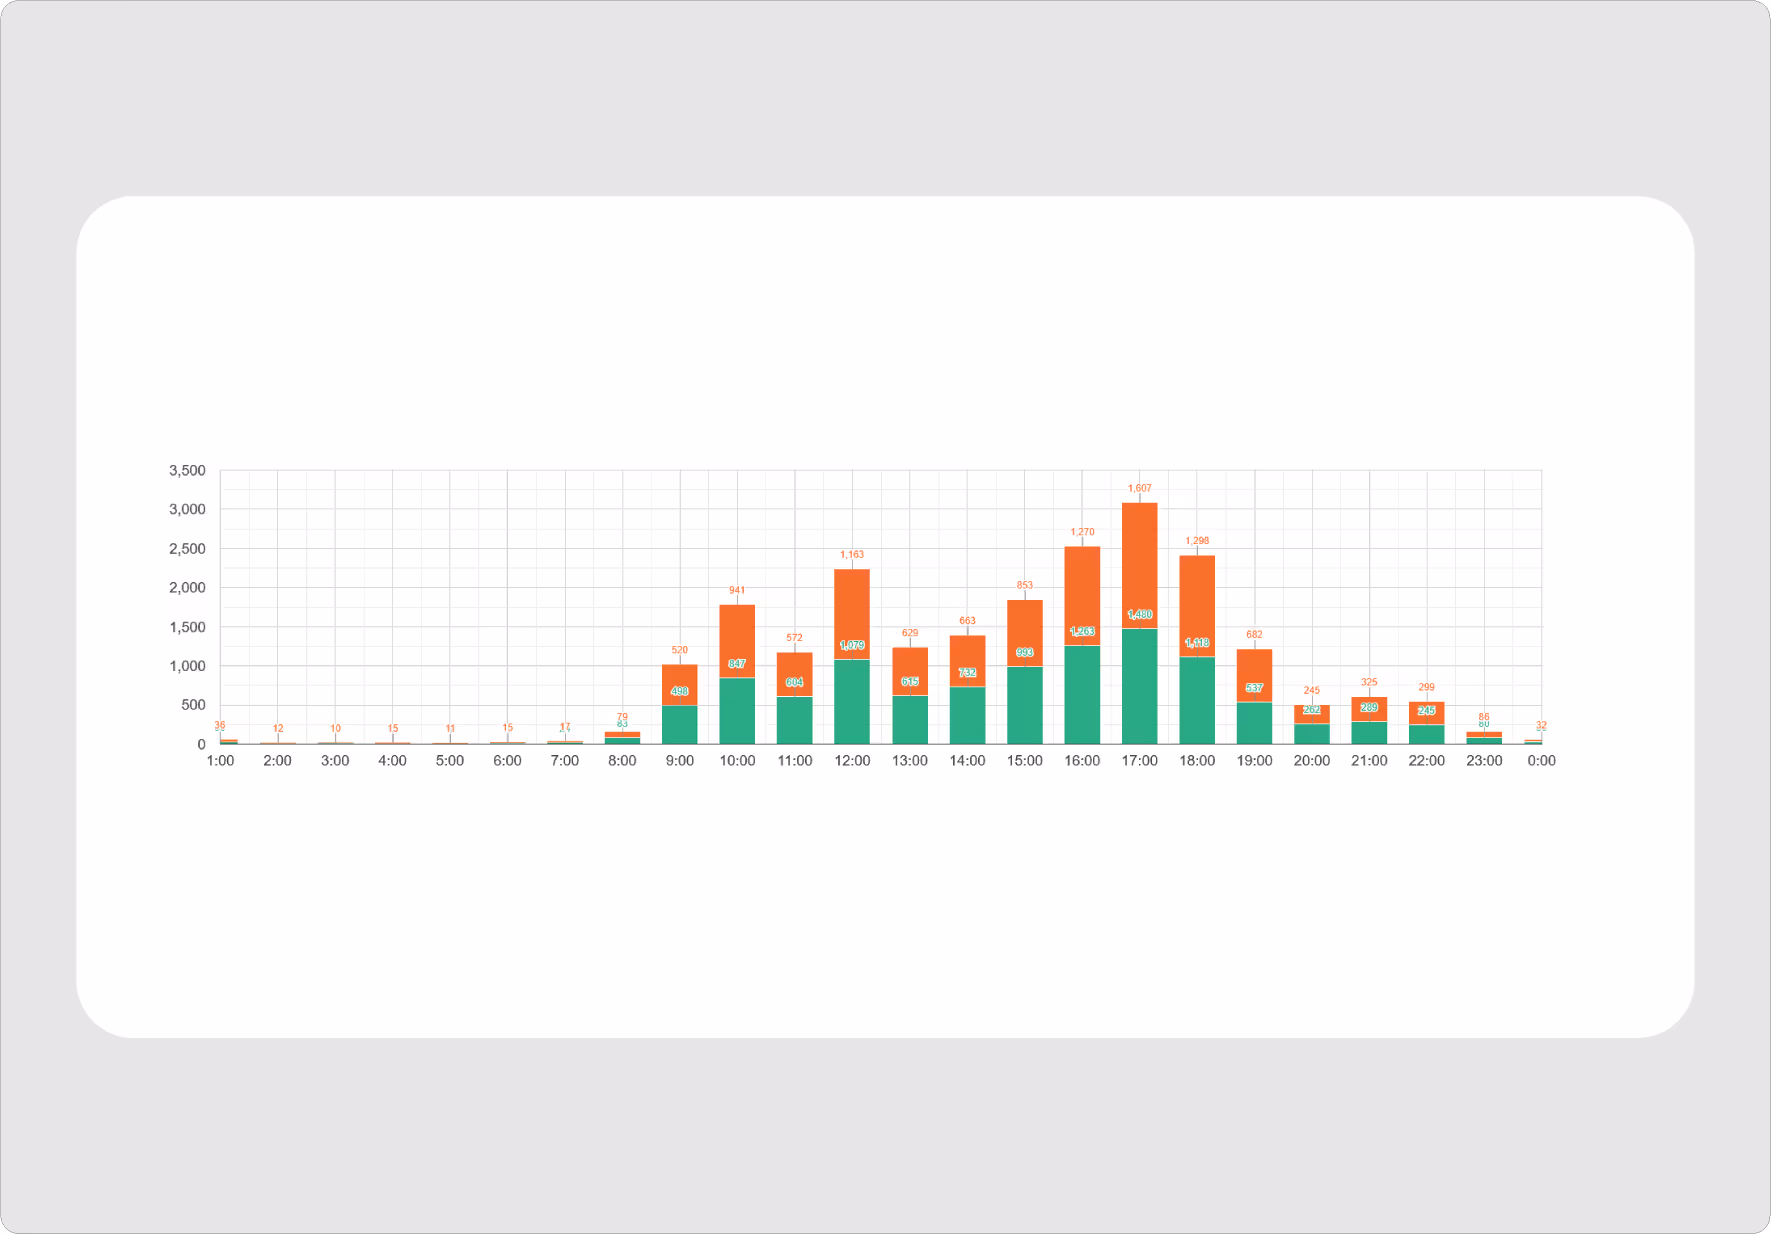
Counts highlight peak hours, weekday/weekend differences and the impact of weather. They reveal corridor attractiveness, utility vs. leisure usage, and periods of ramp-up.
High-pressure intersections, heavily used bridges, sections that saturate at peak arrival and departure times: directional flow data pinpoints where safety or infrastructure continuity needs strengthening.
Data provides objective evidence of the impact of a new facility, a pilot scheme or a configuration change.
Measurement shows how cyclists move between neighbourhoods, stations, employment areas or schools. It provides a concrete basis to plan a coherent, connected network.
Data supports reporting, funding applications and before/after evaluation. It helps document cycling growth across a territory and track policy impacts over time.
Case Studies
Cycling routes do not all behave the same way: attractiveness varies by time of day, intersections can experience pressure peaks, and usage can be strongly concentrated around employment hubs or stations. Below are contexts where cyclist data provides immediate, actionable insight.

Each site is different — we help you choose the easiest and most reliable configuration.


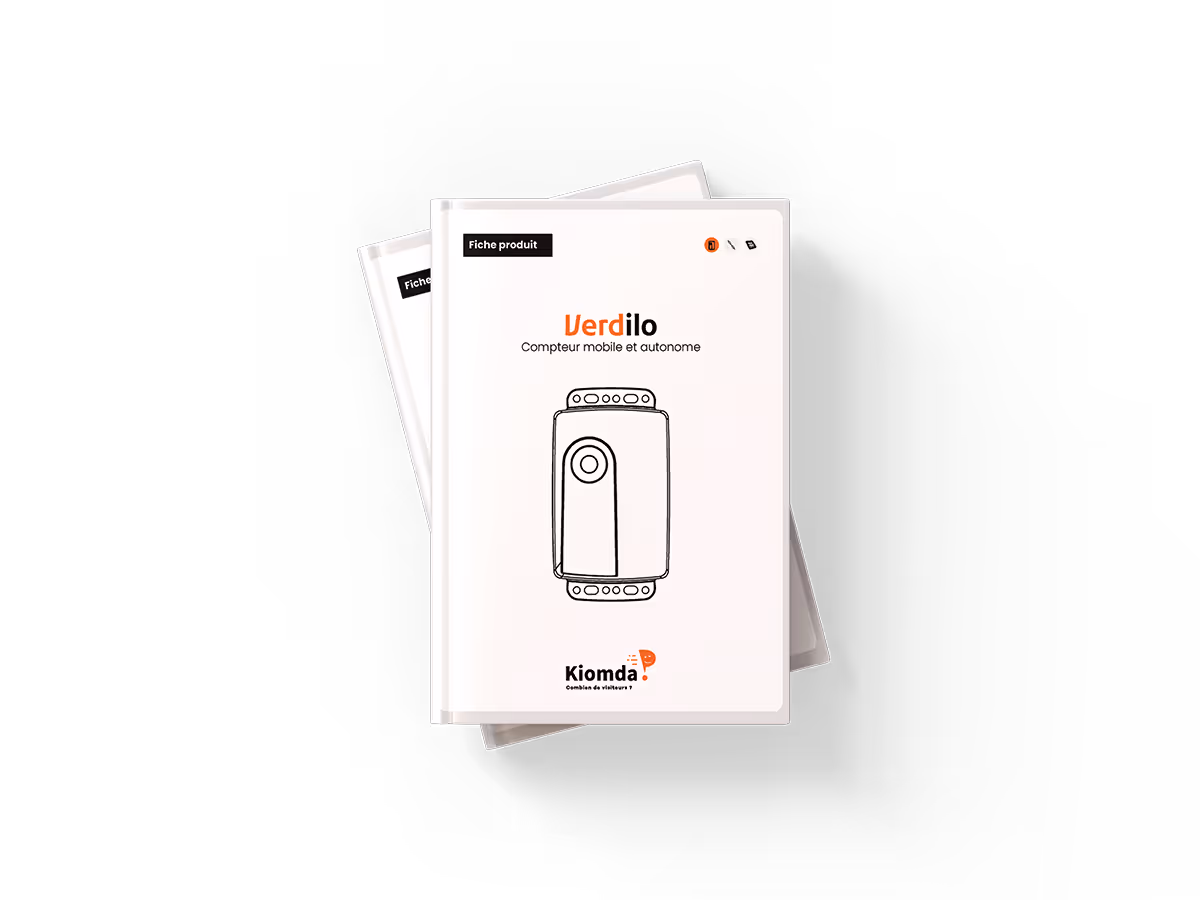
On a greenway or a mixed track (up to 6 meters wide), our Verdilo sensor combines two technologies: thermal detection (which identifies human heat) and magnetic detection. It is this detection of the metal mass of the bicycle that allows us to accurately differentiate a cyclist from a pedestrian or a group of walkers.
Yes — in fact, it's one of our core strengths ! The Verdilo counter is 100% autonomous. It works on a very long battery life (up to 2 years of autonomy) or via a mini solar panel. The installation requires no trenches, no civil engineering and no electrical connections.
No cameras are used. Counting is based on thermal and magnetic fluxes. The data collected is therefore strictly anonymous (no image, no facial recognition). This makes deployment on public roads straightforward, with no GDPR compliance concerns
For isolated or sensitive environments, we have designed specific integration solutions. The sensor can be hidden in a wooden “hollowed post” (which blends perfectly into natural areas), in a wooden birdhouse, or protected by a robust anti-vandalism urban cover.
To preserve battery life in remote environments, data is not transmitted continuously. They are sent automatically every 12 hours to your online platform (Reports). This allows you to calmly analyze peak traffic, seasonality and daily uses to better size your cycling facilities.
Our sensors, by default, transmit data every 12 hours. This frequency can be set on request. However, if the transmission frequency is increased, this will have consequences on the autonomy of the meter. In fact, we also have a manual data recovery solution for sites that do not have a connection, guaranteeing reliable data tracking, even in isolated locations or without a network.

.svg)