English
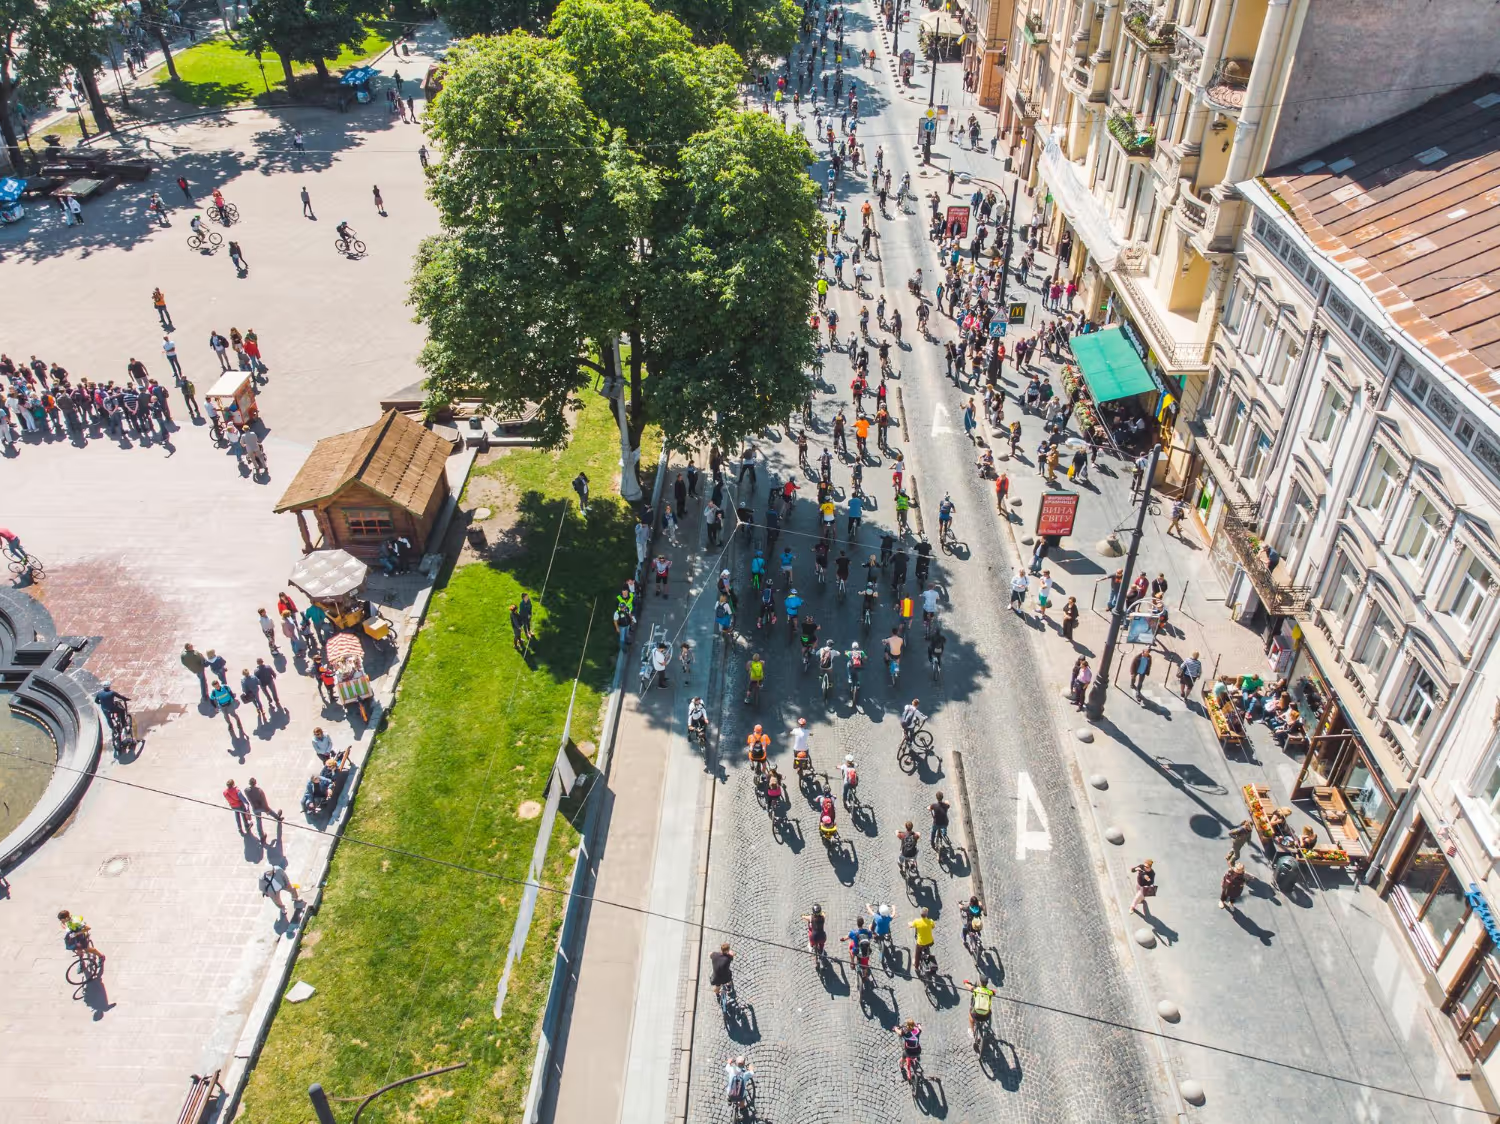
Understand the multiple uses of parks, squares and pedestrian streets — beyond impressions.



































Parks and pedestrian areas have common characteristics that make them difficult to manage:
The same space can be quiet in the morning, saturated at noon, deserted in winter, busy in summer.

Leisure, sport, relaxation, through-traffic, retail activity and temporary events all coexist.
Most communities must adjust their teams according to the reality on the ground.
Pedestrians, vehicles, cyclists and scooters all share the same space.
Commercial revitalisation, park redevelopment, pedestrianisation extensions — all require evidence
Conçu pour les environnements extérieurs, sans travaux ni câblage.


Fonctionne sans alimentation électrique (autonomie estimée à plus de 2 ans).

Mise en place en 2 minutes, sans expertise requise, livré prêt à l'emploi.

Conçu pour les conditions extérieures, en milieu naturel ou urbain.

Aucune image enregistrée, conformité RGPD.

Capable d’identifier séparément les passages de piétons, cyclistes et véhicules, selon le type de comptage sélectionné.

Consultation en ligne ou relevé local dans les zones isolées.
Technologie thermique : le capteur lit la chaleur corporelle de chaque usager. Le magnétomètre lit le passage dses éléments métalliques. Aucune caméra, aucune image, aucune donnée personnelle.

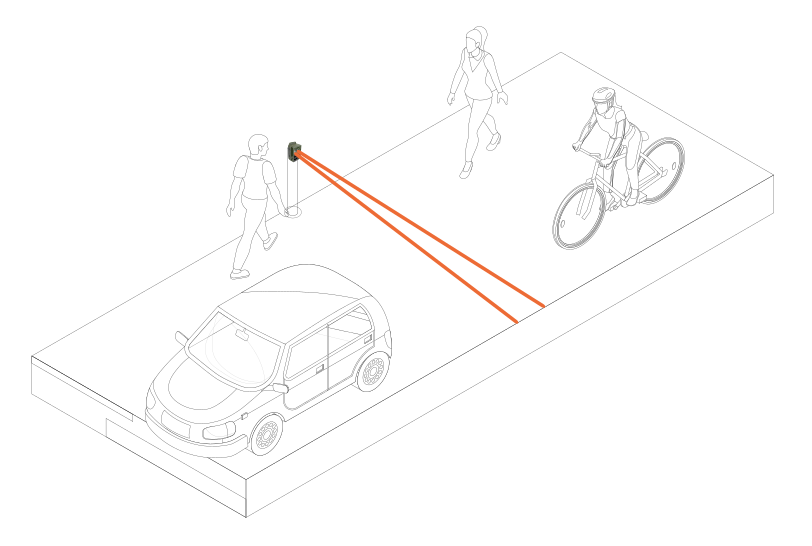
Chaque passage est horodaté et classé par mode et par sens.
Les données sont agrégées en tranches de 15 minutes directement dans le boîtier.
Selon la régularité choisie (de 5mn à 24h), le boîtier envoie ses données via le réseau disponible.
Sans réseau, un relevé Wi-Fi local reste possible.
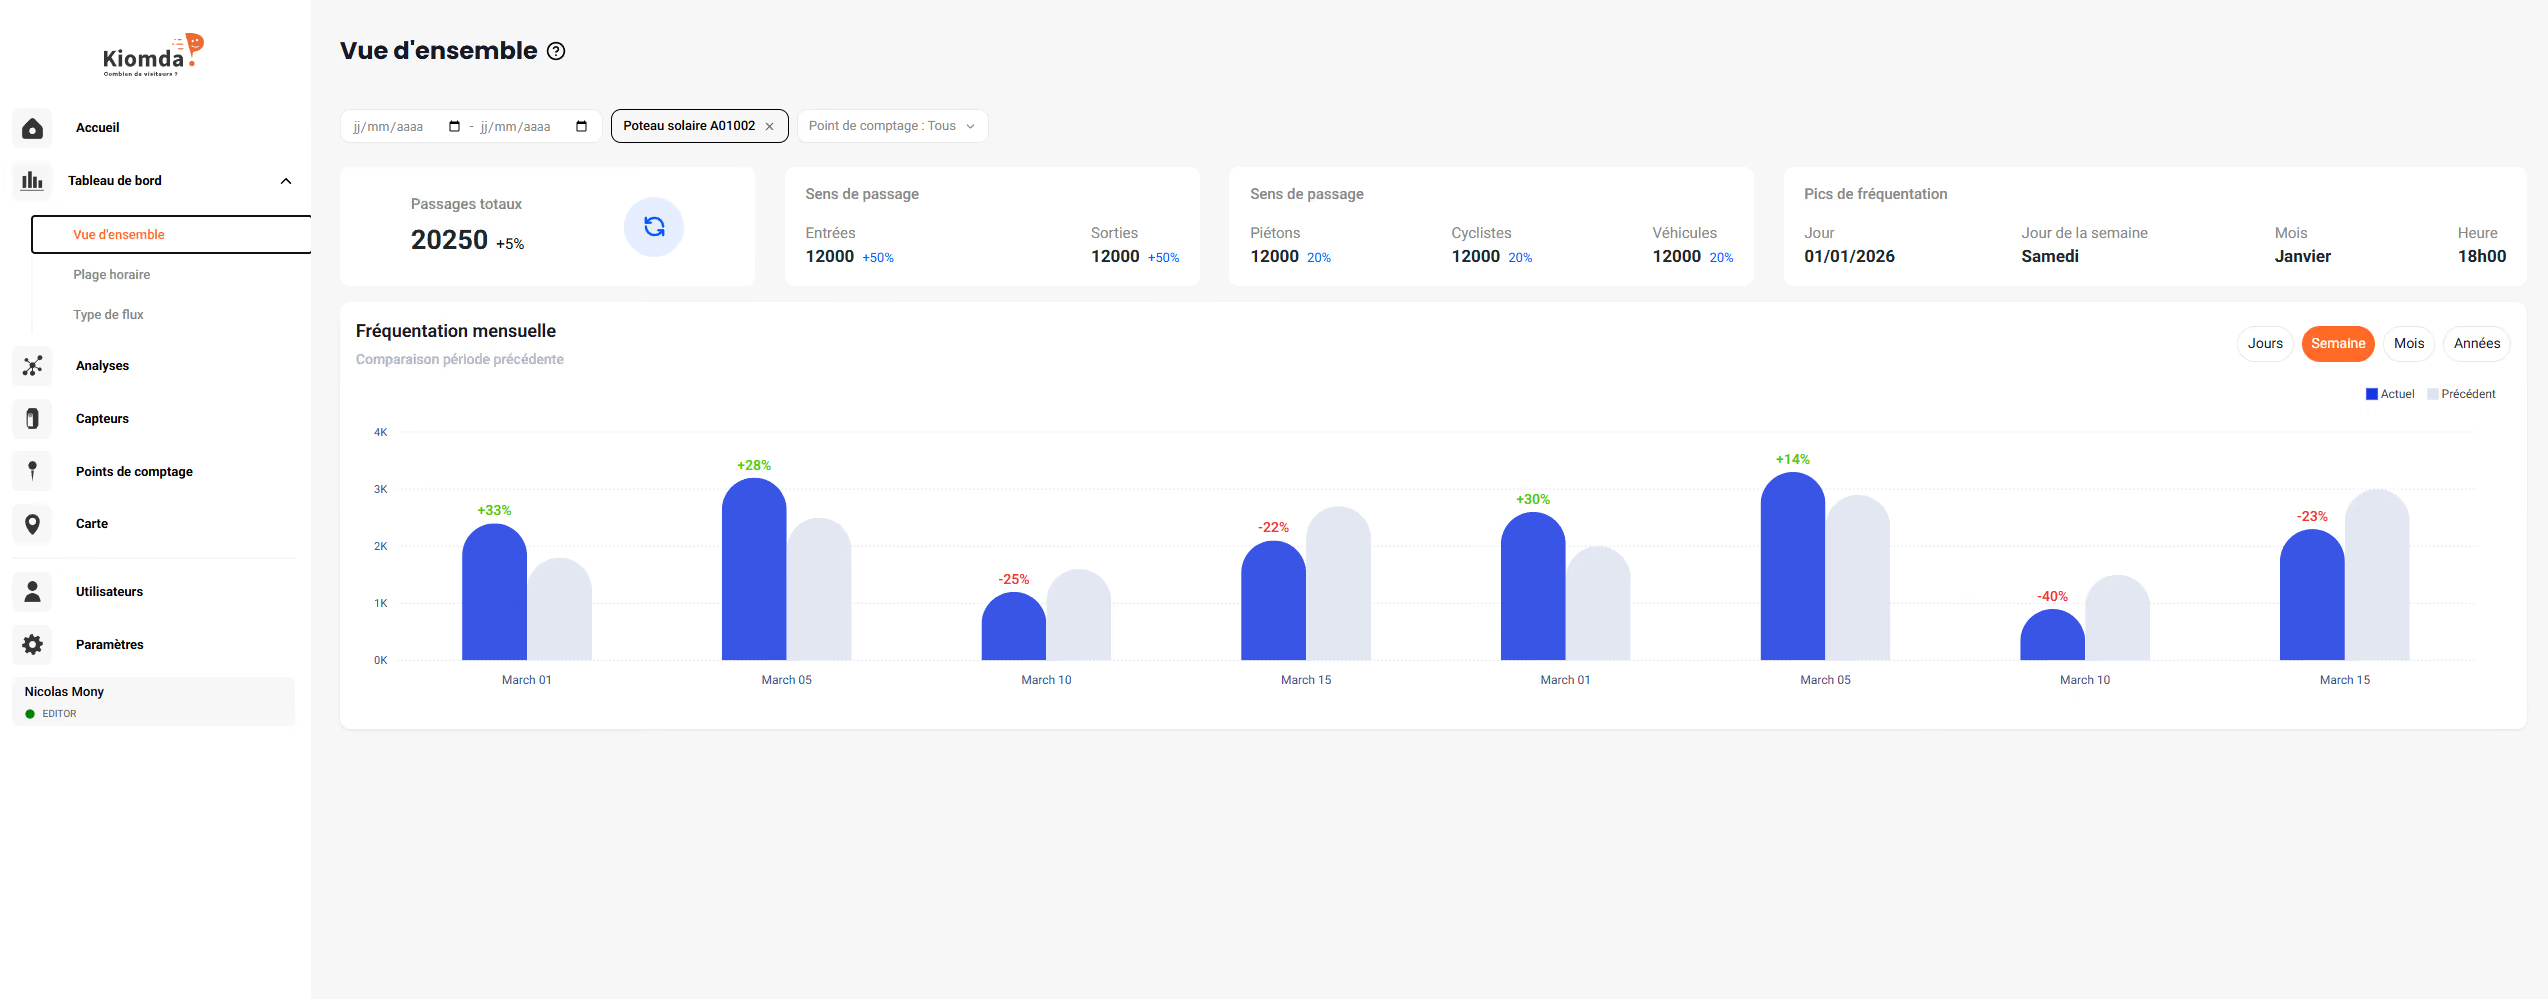
La plateforme Kiomda Report affiche courbes horaires, totaux journaliers et comparaisons saisonnières depuis n'importe quel navigateur


Le boîtier standard est résistant aux intempéries et conçu pour un usage extérieur. Sa forme épurée et discrète s'intègre naturellement aux environnements urbains et naturels.


Un habillage renforcé anti-vandalisme, parfaitement adapté aux zones fréquentées par le public. Ce modèle est conçu pour résister à tout type de dégradation.


Un nichoir qui se fond dans les environnements naturels – idéal pour les réserves naturelles, les parcs et les zones protégées.


Un poteau en bois qui dissimule entièrement le capteur — idéal pour les voies vertes, les chemins ruraux et les sites patrimoniaux où l'impact visuel doit être minimal.

Understanding peak times, quiet periods and seasonal patterns helps you adjust maintenance, staffing and schedules. Counting also reveals the impact of a new layout or activation.
Footfall data reveals the real attractiveness of a street, regardless of how it feels. It helps document a revitalisation project, assess a before-and-after, or support a funding application.
Some streets function more as transit corridors than as places to linger. Counting reveals these movement patterns and informs decisions on signage, safety measures or traffic calming.
Even in areas where users linger, footfall at access points can be measured to track attendance trends, detect saturation moments and plan public space management accordingly.
Local events significantly alter footfall patterns. Measurement helps right-size teams, anticipate peaks and understand the real impact of these activities on urban life.
Near a playground, library, sports centre or school, counting reveals usage rhythms — useful for adapting management, improving safety or planning infrastructure works.

Attendance data is more than a final indicator. It structures your operations, secures your spaces and documents what is really happening on the ground.
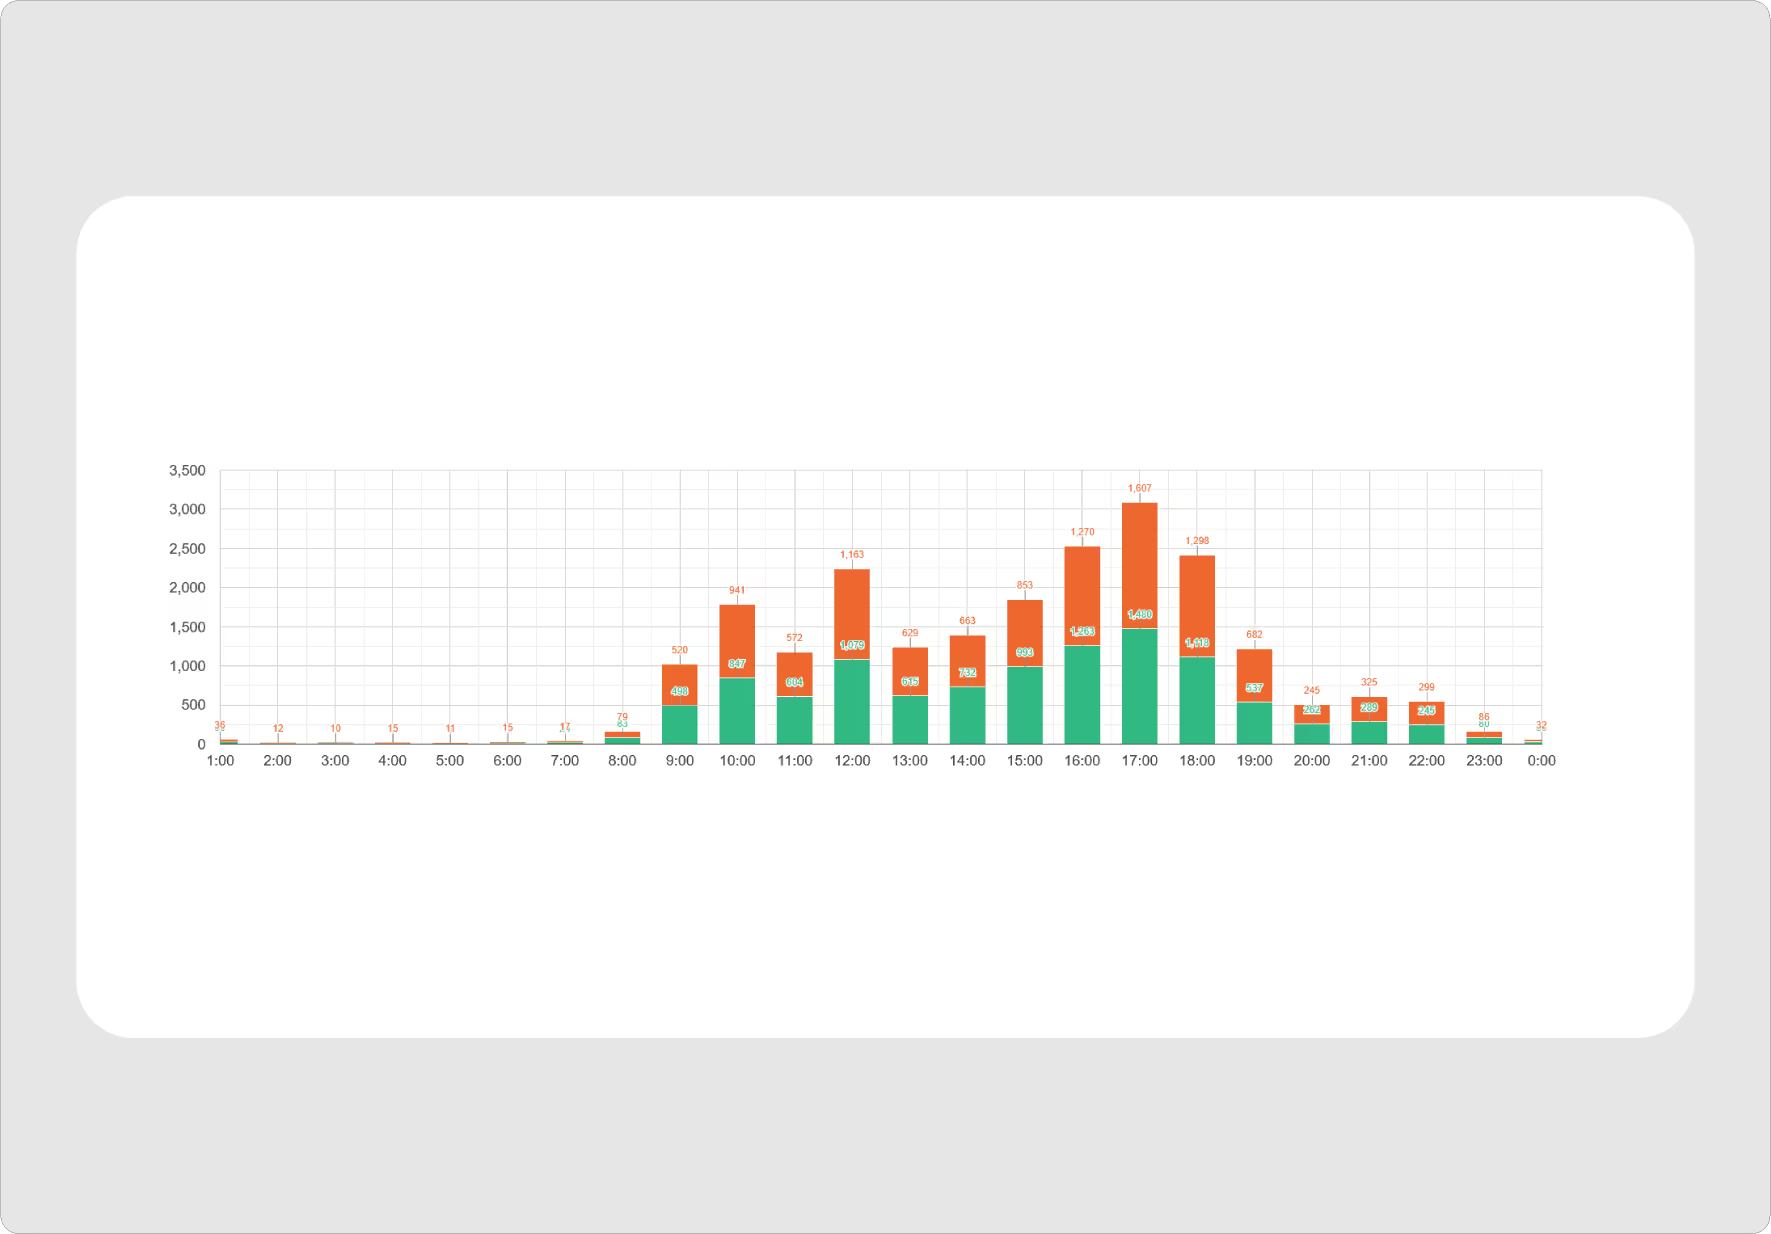

Plan maintenance, adjust staffing, anticipate peak moments and identify underused areas.

Understand usage rhythms, prevent overcrowding, anticipate conflicts between users and right-size interventions.

Measure site attractiveness, support funding applications, quantify the impact of a development project and track an action plan over time.
Case Studies
Choose the solution that fits your needs
Whether you require continuous monitoring or a one-off analysis, our visitor counting solutions adapt to your projects with turnkey services.

A long-term investment to continuously equip your sites and own your attendance data.
For local authorities and site managers with ongoing monitoring needs.


A turnkey solution for testing, piloting, or measuring attendance during a one-time event, starting from €500.
Ideal for one-off events (festivals, trade shows, sports competitions), pre-purchase tests/pilots, and seasonal needs.
Submit your request online. Our team will help you design a solution tailored to your site.
We configure your sensor to your specifications and ship it ready to use — no complex setup required.
Attach the sensor to the right location: post, tree, street furniture. No wiring or external power supply needed.
The collected data is sent every 12 hours to our secure platform (frequency adjustable on request), where it is analyzed and formatted.
Access detailed statistics and use our analysis tools to optimise your infrastructure and make data-driven decisions.

Each site is different — we help you choose the easiest and most reliable configuration.


Here we have put together the most frequently asked questions about our Verdilo counting solutions. If you can't find your answer, contact us directly
Yes, our sensors can distinguish between pedestrian and cyclist flows, even on shared lanes, in both directions.
Absolutely. Our data can help demonstrate a site’s usage and justify investments or upgrades in funding proposals to public authorities or partners.
Yes, we offer rental solutions starting from one day up to several months — perfectly suited for temporary events such as festivals, trade shows, performances, or one-off studies.
Not at all. Installation takes just two minutes — no power supply or civil works needed. The sensor can be mounted on a post, wall or integrated into a discreet housing (wooden post, street furniture, bird-box).
With default settings (data transmission every 12 hours), our counters are designed to operate for at least 2 years without external power. If you increase the transmission frequency, battery life will decrease due to higher energy consumption. This flexibility allows you to tailor the sensor’s operation to your needs while maintaining long-term performance.
By default, our sensors transmit data every 12 hours. This frequency can be adjusted on request. However, increasing the frequency reduces battery life. For locations without network access, we also offer a manual data collection solution — ensuring reliable tracking even in remote or offline areas.
Yes, our sensors are built to be robust, waterproof, and to operate in all weather conditions — rain, snow, or extreme temperatures.
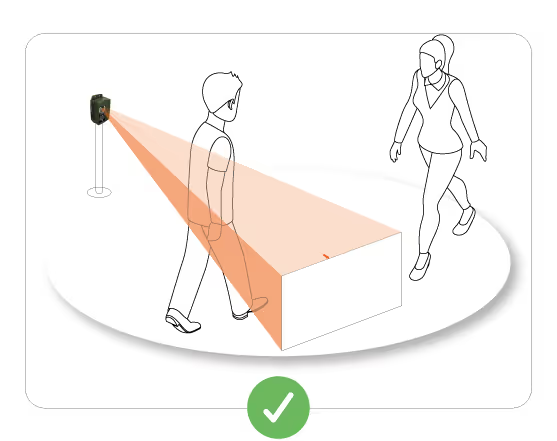
Yes, the Verdilo counter is designed to handle high traffic volumes and can accurately distinguish users even during crowded events. For optimal performance, we recommend placing the counter in a passage area where users are naturally filtered one by one (for example, near a barrier, gate, or controlled access point). Without such filtering, a group might be counted partially or as a single person. Proper positioning ensures accurate counting, even in busy conditions.
Yes, all data collected by our counters is 100% anonymized and compliant with data protection regulations, including the General Data Protection Regulation (GDPR). Verdilo uses thermal detection technology — not a camera. It does not capture images or collect personal data. The process is fully anonymous, with no way to identify individuals. Furthermore, no individual tracking is performed: only aggregated, quantitative data is transmitted.

.svg)
.avif)