English
Understand how cyclists actually use infrastructure and how flows are distributed over time.


Cycling uses vary according to time of day, weather, configuration and interactions with other modes. Without data, these dynamics remain difficult to assess. The measurement provides objective insight to understand flows and guide planning decisions.
Home-to-work commuting, weather conditions and seasonal patterns all create significant usage variations. Data helps identify peak demand periods and size infrastructure accordingly.
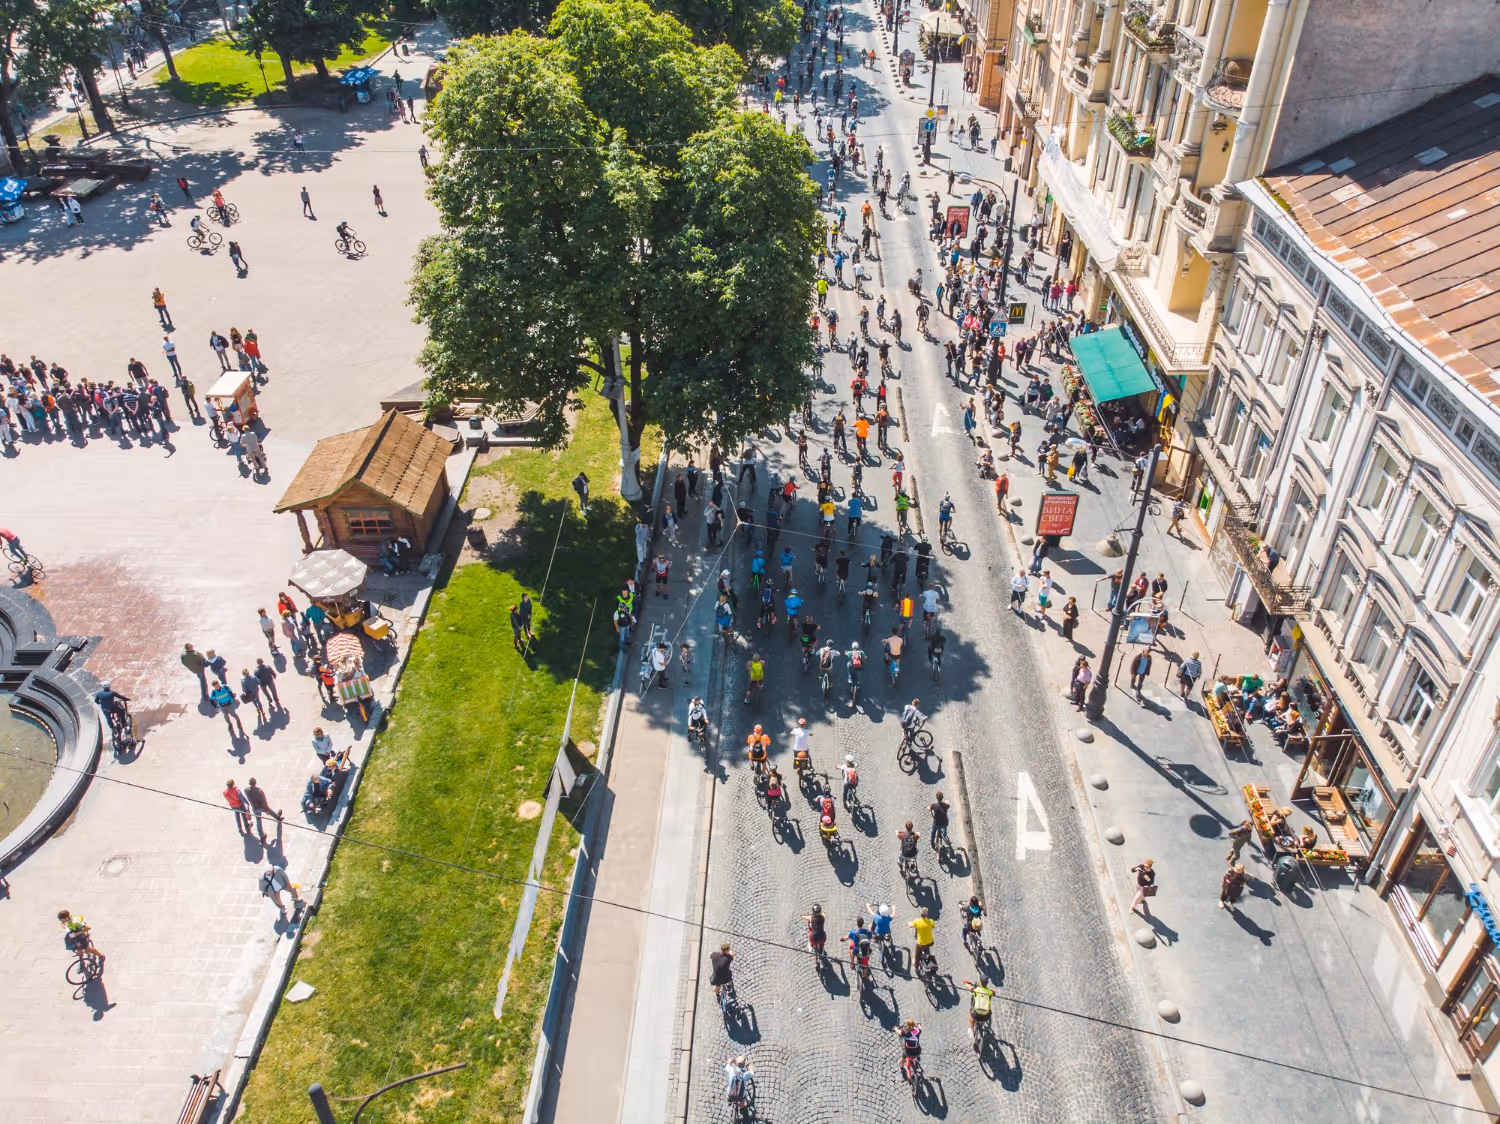
Narrow lanes, isolated greenways, urban crossings, footbridges, junctions — each context generates different usage patterns. Measurement reveals both underused corridors and saturated sections.
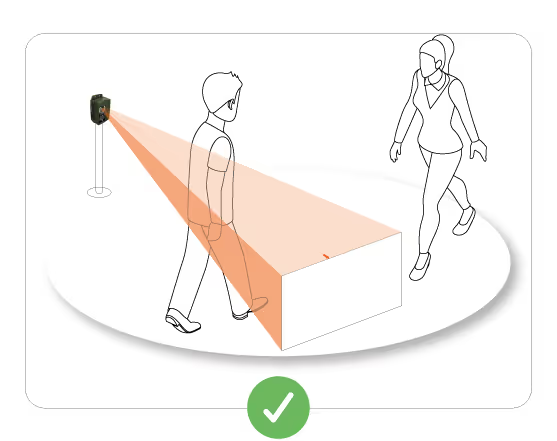
Cyclists, pedestrians and vehicles each move at different speeds and along different trajectories. Verdilo differentiates between modes where site conditions allow.
Extensions and infrastructure changes require solid indicators. Data provides objective proof of a project's relevance and impact.
The growth of utility cycling, the rise of e-bikes and changing commuting habits are reshaping how routes are used. Continuous measurement captures these shifts as they happen.
Technologies
Designed for outdoor environments, no installation or wiring required.
Operates without external power (estimated battery life of over 2 ).
Set up in 2 minutes, no expertise required, delivered ready to use.
Designed for outdoor conditions, in natural or urban environments.
No images recorded, GDPR compliant.
Capable of separately identifying pedestrians, cyclists, and vehicles, depending on the selected counting type.
Online consultation or local data collection in isolated areas.


Thermal technology: the sensor reads each user's body heat. No camera, no images, no personal data.

Each passage is timestamped and classified by mode and direction. Data is aggregated into 15-minute intervals directly within the device.
Depending on the chosen frequency (from 5 min to 24 h), the device sends its data via the available network. If there's no network, local Wi-Fi data collection is still possible.
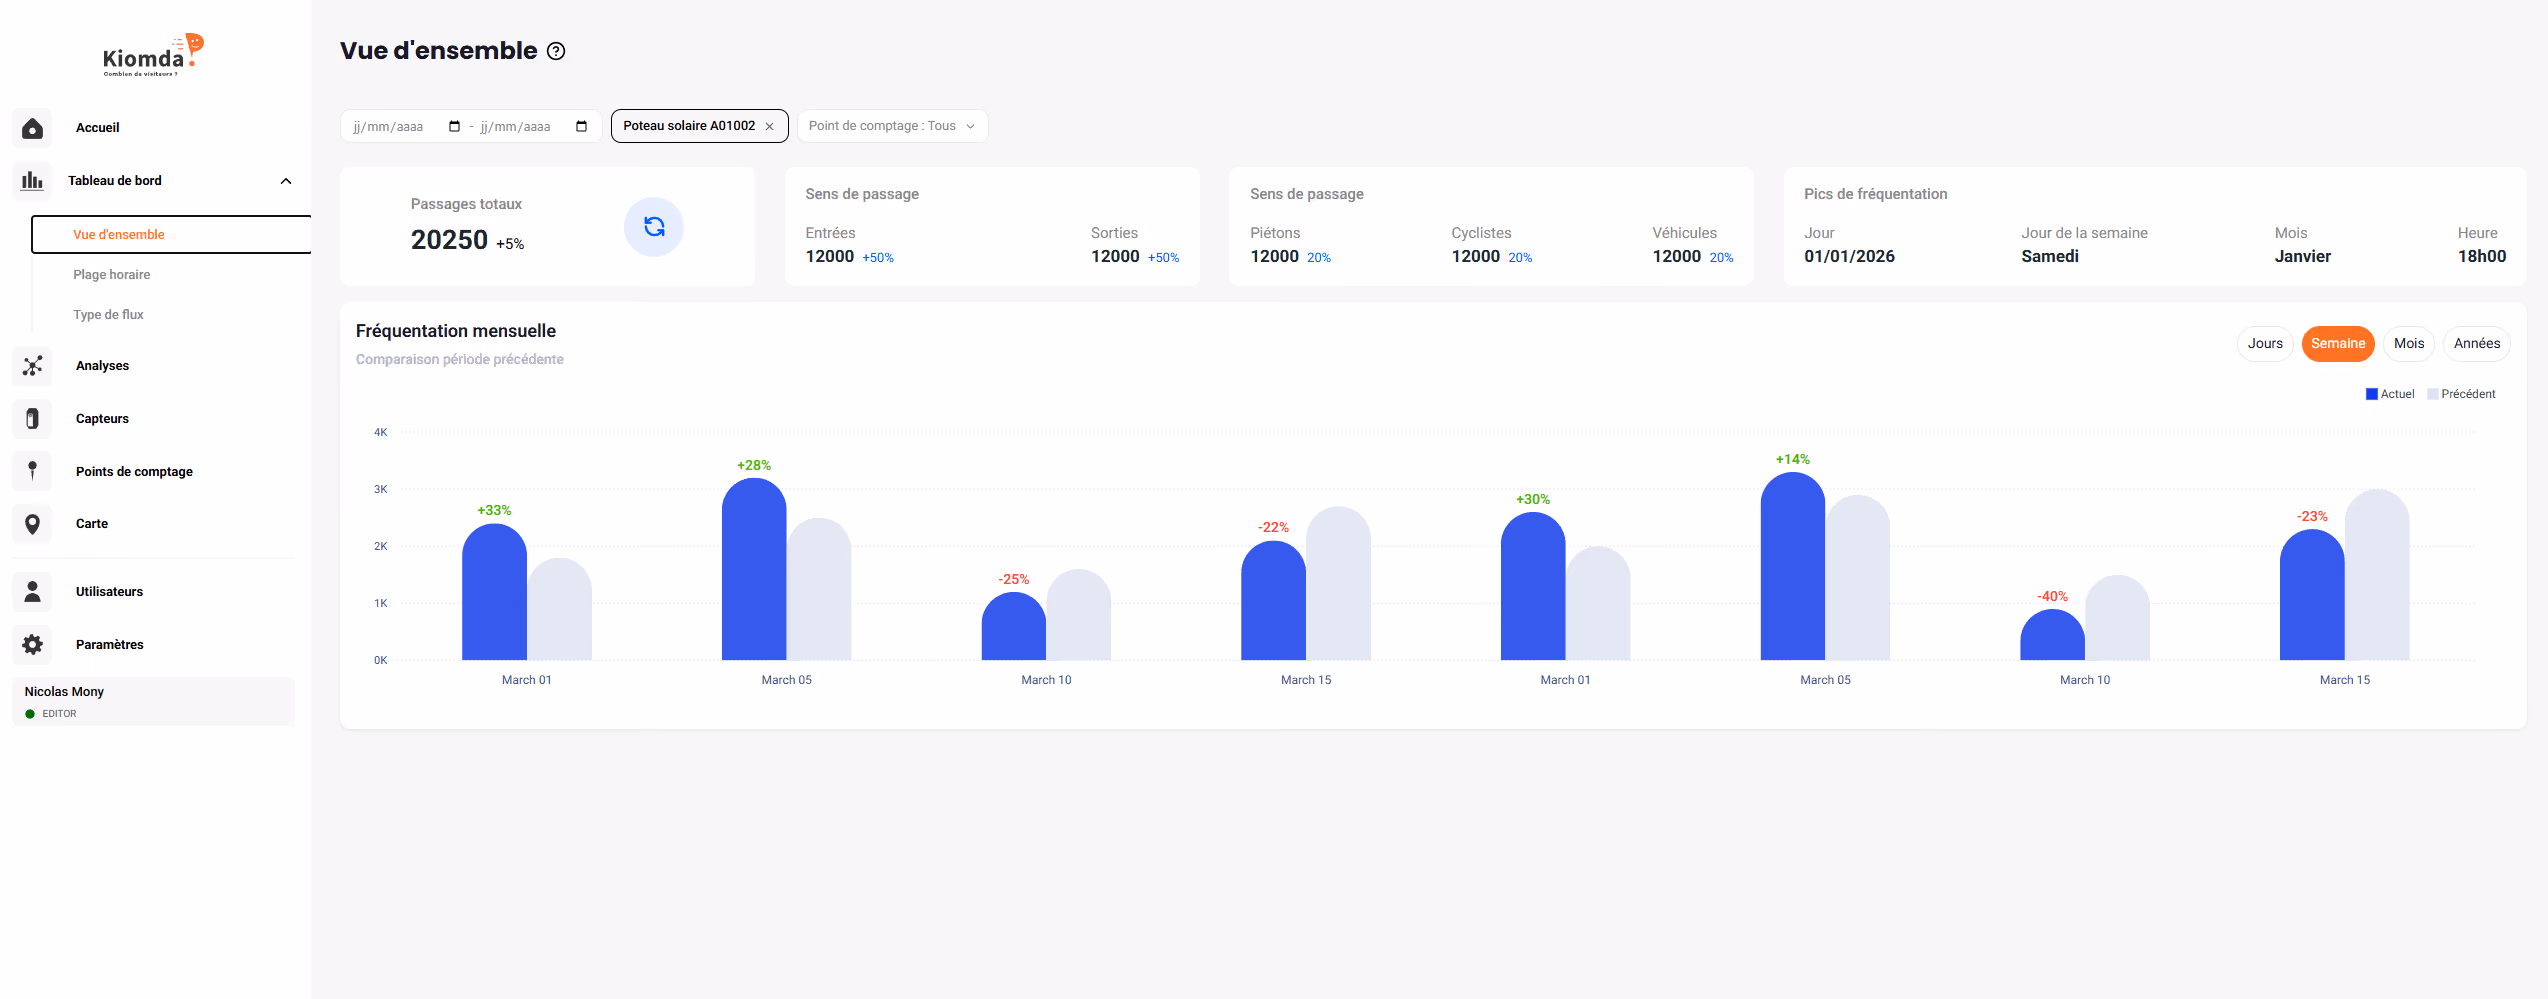
The Kiomda Report platform displays hourly charts, daily totals, and seasonal comparisons from any browser.


The standard casing is weather-resistant and designed for outdoor use. Its sleek and discreet shape blends naturally into urban and natural environments.


A reinforced, vandal-proof casing, perfectly suited for areas with high public traffic. This model is designed to withstand all types of damage.

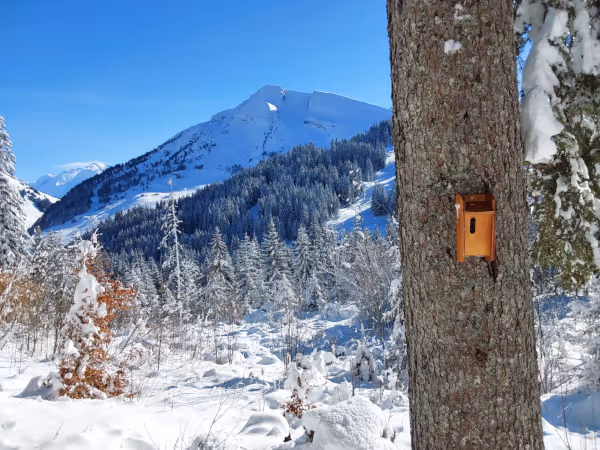
A birdhouse that blends into natural environments – ideal for nature reserves, parks, and protected areas.


A wooden post that completely conceals the sensor — ideal for greenways, rural paths, and heritage sites where visual impact must be minimal.
For structured bicycle facilities and busy roads, Spirilo is based on a technology of buried electromagnetic loops, directly integrated into the roadway.
Each user pass generates a disturbance in the electromagnetic field, analyzed by the system to produce a reliable count, even in dense traffic.
Unlike above-ground sensors, this approach allows measurement without obscuration: cyclists can follow each other closely without degrading the quality of the data.
The specific geometry of the loop also allows for a more detailed analysis of uses, with the possibility of distinguishing bikes from scooters.
Electromagnetic detection provides stable measurements, independent of external conditions (light, weather, ambient temperature).
The loops are directly integrated into the road surface, with no visual impact or surface installation constraints.
No electrical connection required, runs on a long-life battery.
The system can be connected to existing loops, allowing for the modernization of a setup without extensive intervention.
The electromagnetic signature makes it possible to qualify flows and distinguish between different types of users.

On a narrow road where cyclists travel in both directions, two successive loops allow the direction of passage to be reconstructed.

On a one-way track, one or two loops make it possible to measure a homogeneous and continuous flow, with great precision.

On a wide or separate track, loops positioned side by side and then downstream make it possible to clearly distinguish the two directions of traffic, even in case of heavy traffic.
Cycling usage evolves rapidly with the time of day, season, local infrastructure and user practices. Regular data helps you move beyond assumptions and base decisions on objective trends. These indicators provide a clear picture of actual usage and support the planning of active travel initiatives.
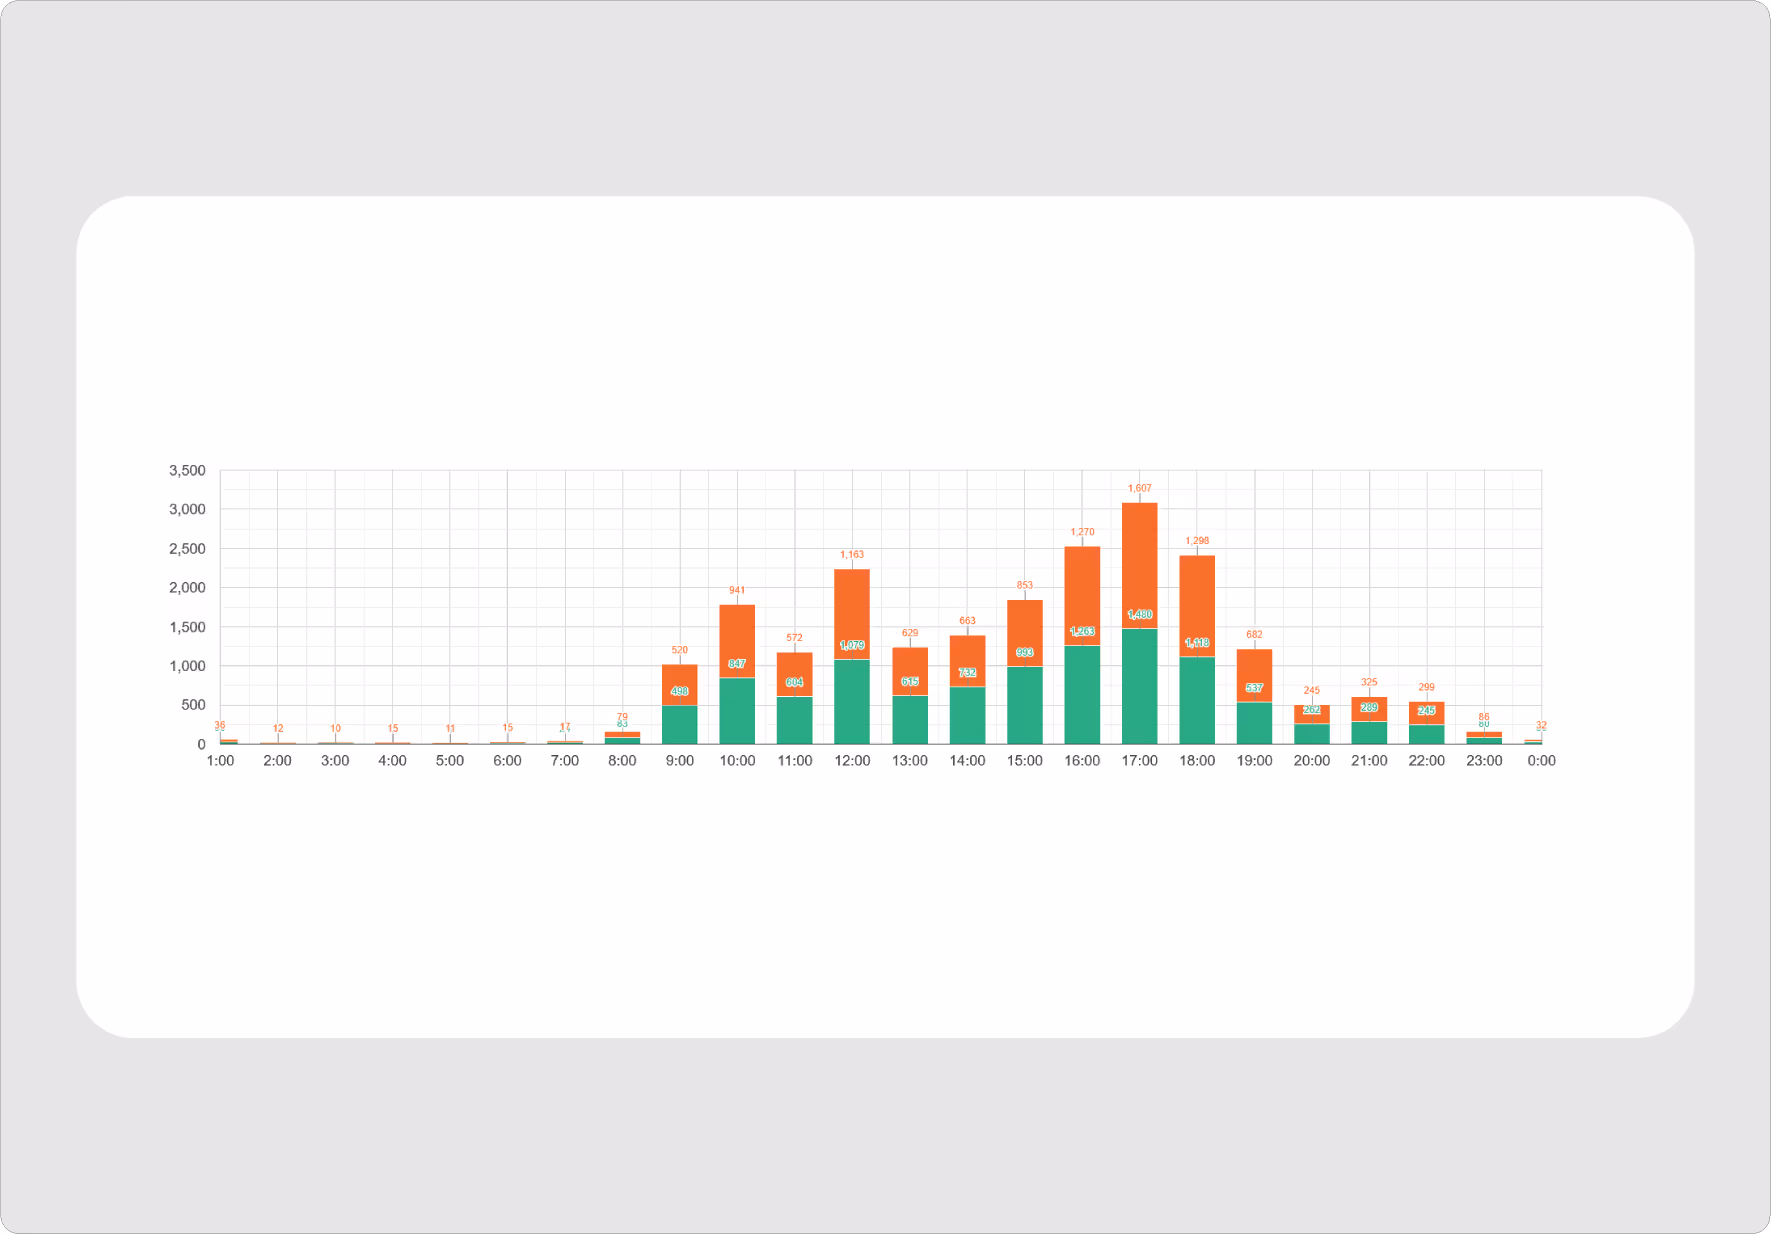
Analyse hourly, daily and seasonal variations. Identify peak demand periods, underused corridors and most-used routes.
Build an objective evidence base for protective measures, signage, regulation or new route creation. Consolidated data makes decision-making straightforward.
Footfall indicators support mobility plan documentation, responses to project tenders and funding applications.
Case Studies
Choose the solution that fits your needs
Whether you require continuous monitoring or a one-off analysis, our visitor counting solutions adapt to your projects with turnkey services.

A long-term investment to continuously equip your sites and own your attendance data.
For local authorities and site managers with ongoing monitoring needs.

A turnkey solution for testing, piloting, or measuring attendance during a one-time event, starting from €500.
Ideal for one-off events (festivals, trade shows, sports competitions), pre-purchase tests/pilots, and seasonal needs.

Submit your request online. Our team will help you design a solution tailored to your site.
We configure your sensor to your specifications and ship it ready to use — no complex setup required.
Attach the sensor to the right location: post, tree, street furniture. No wiring or external power supply needed.
The collected data is sent every 12 hours to our secure platform (frequency adjustable on request), where it is analyzed and formatted.
Access detailed statistics and use our analysis tools to optimise your infrastructure and make data-driven decisions.
Each site is different — we help you choose the easiest and most reliable configuration.


.svg)