The Kiomda web platform is a dedicated tool that allows users to monitor, analyze, and utilize the data collected by their counting devices. With an intuitive, online-accessible interface, clients can consult real-time or historical traffic data, whether for pedestrians, cyclists, or vehicles.
Upon logging in, you’ll access a comprehensive dashboard summarizing key statistics for your site:

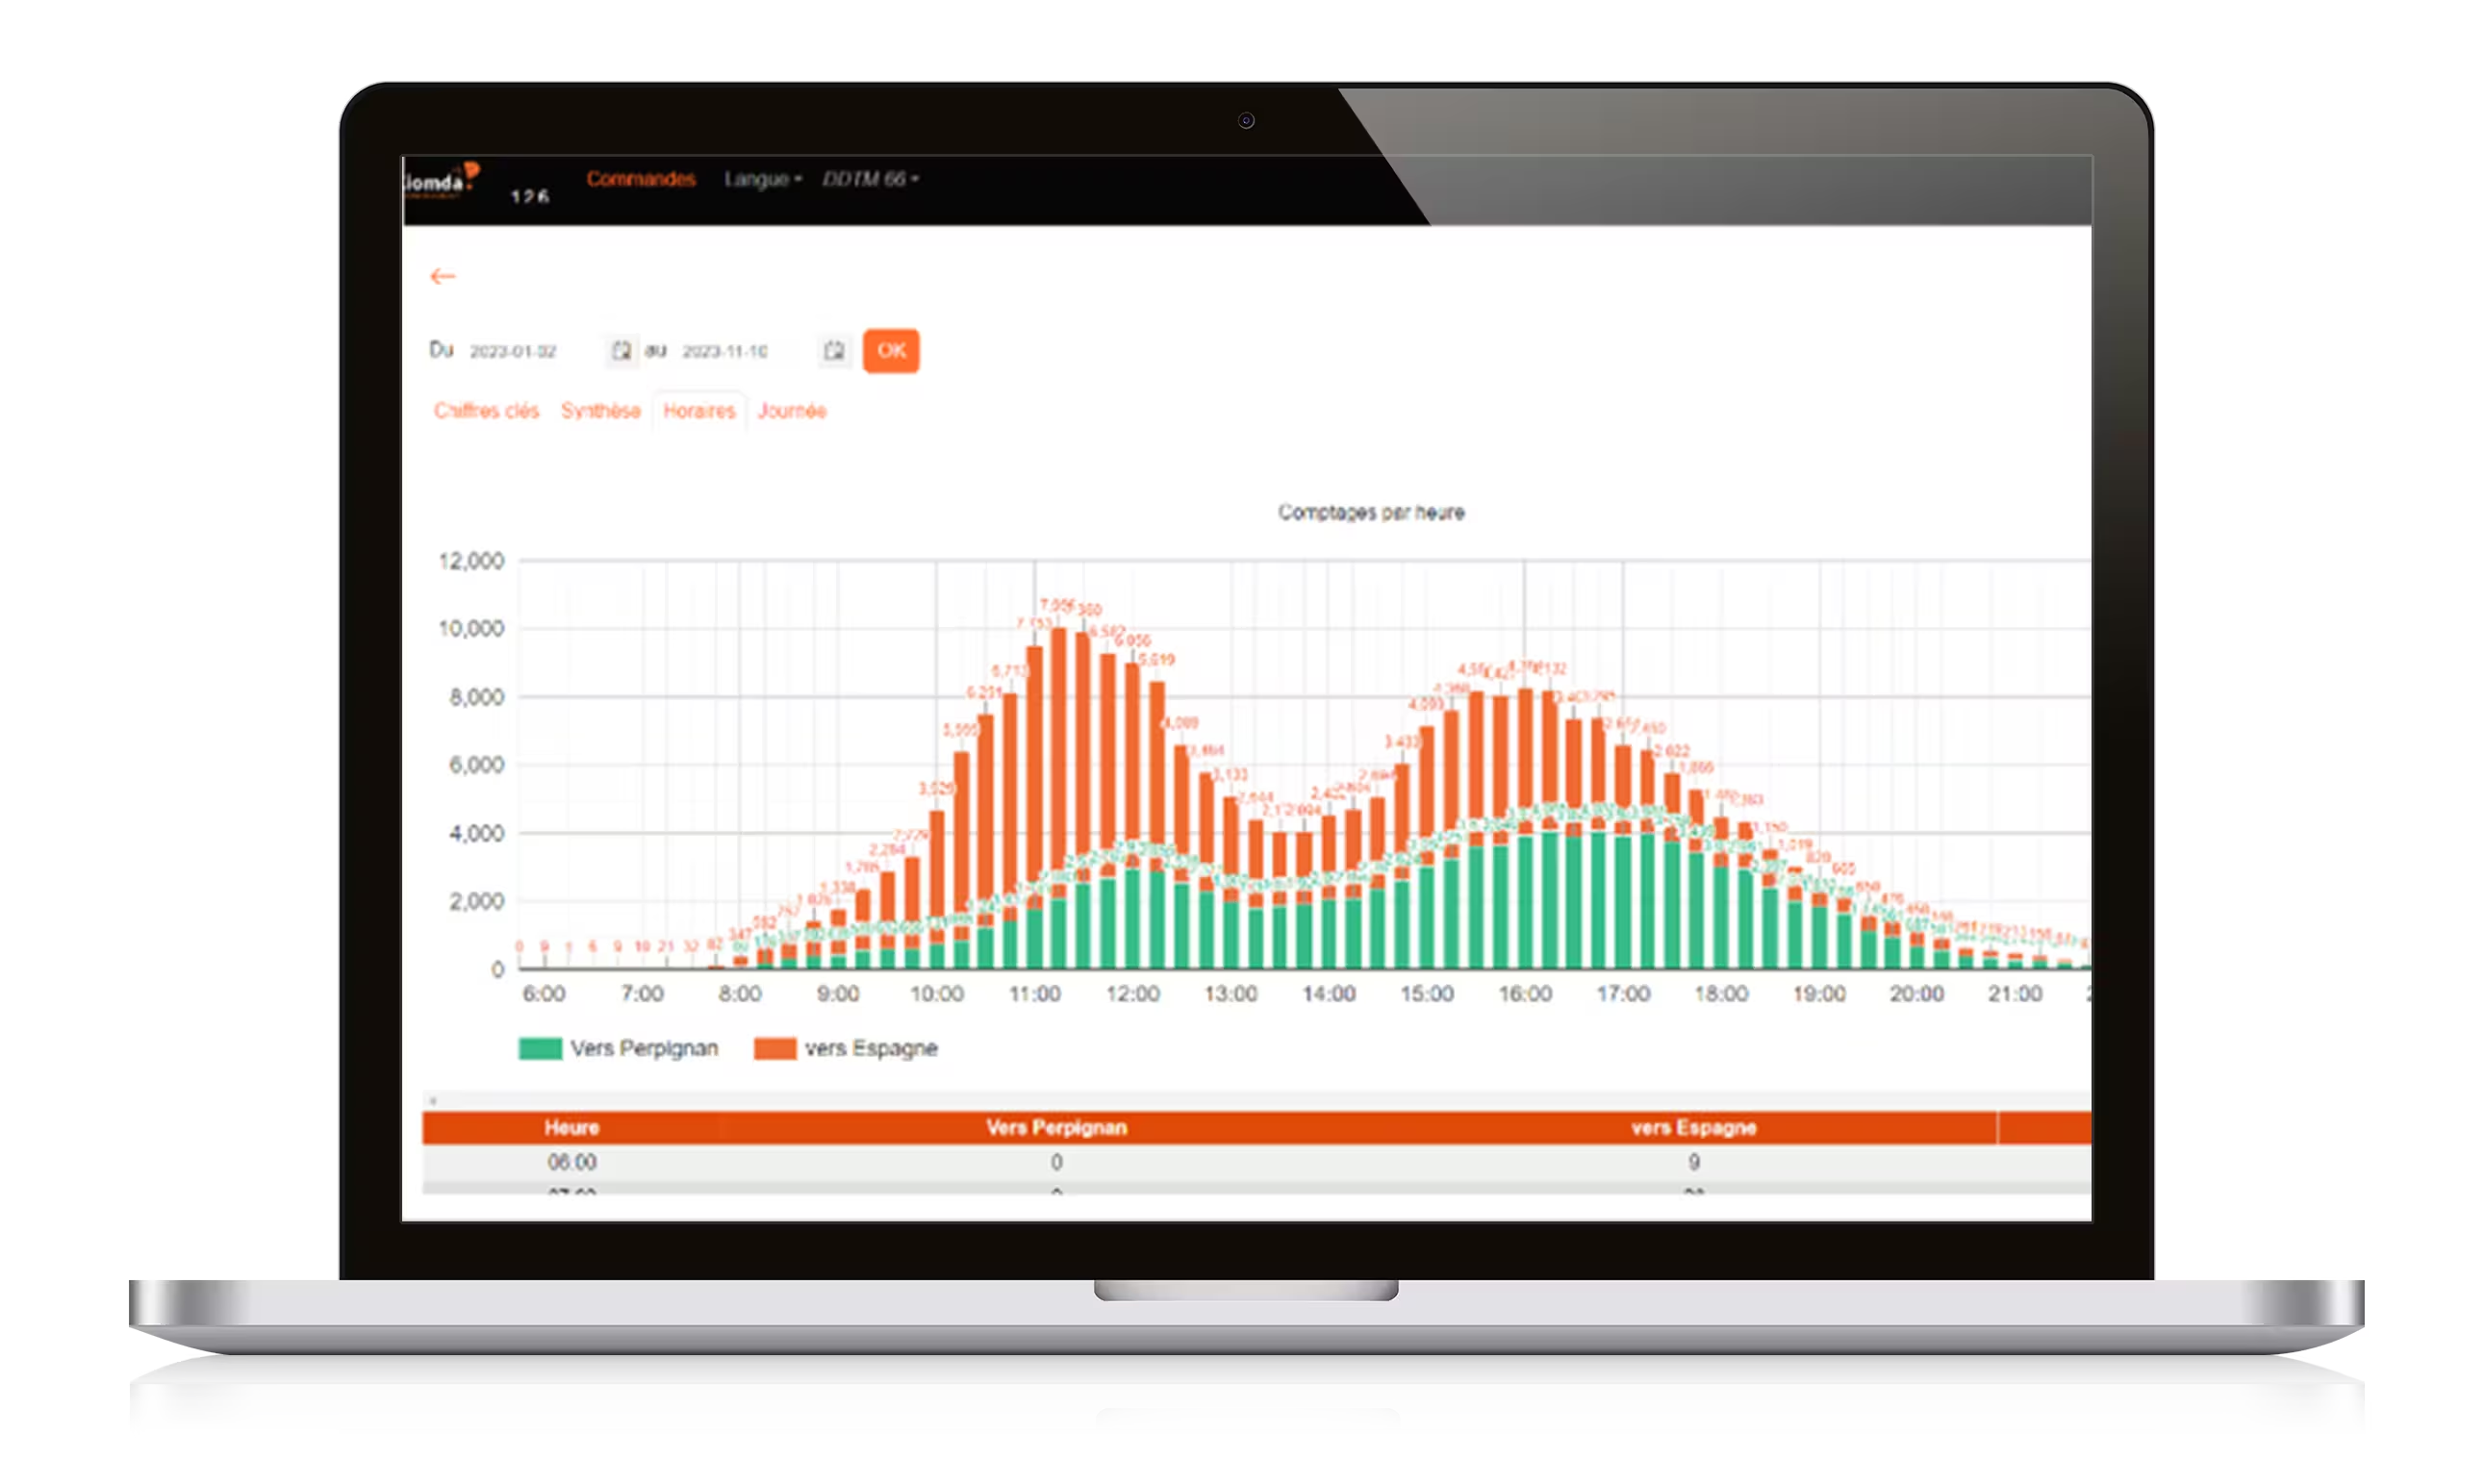
With exportable and graphical data visualization, you can compare:
Data is recorded in 15-minute intervals, enabling precise analysis of incoming and outgoing traffic.


The platform allows data to be exported in multiple formats (Excel, PDF, CSV) for integration into management reports or presentations for policymakers and stakeholders.
✅ Une interface intuitive et accessible en ligne, sans installation logicielle complexe.Intuitive, web-based interface – No complex software installation required.
✅ Accurate and reliable data, available in real time or on demand.
✅ Advanced analytics tools to adapt urban planning and mobility strategies.
✅ Flexible use, with customizable counting campaigns and exportable reports.
✅ Technical support to optimize data utilization and adjust sensor placement.


