End of life of 2G/3G networks: a subject that concerns some market players, not Kiomda.
Read the article

When several mobilities coexist

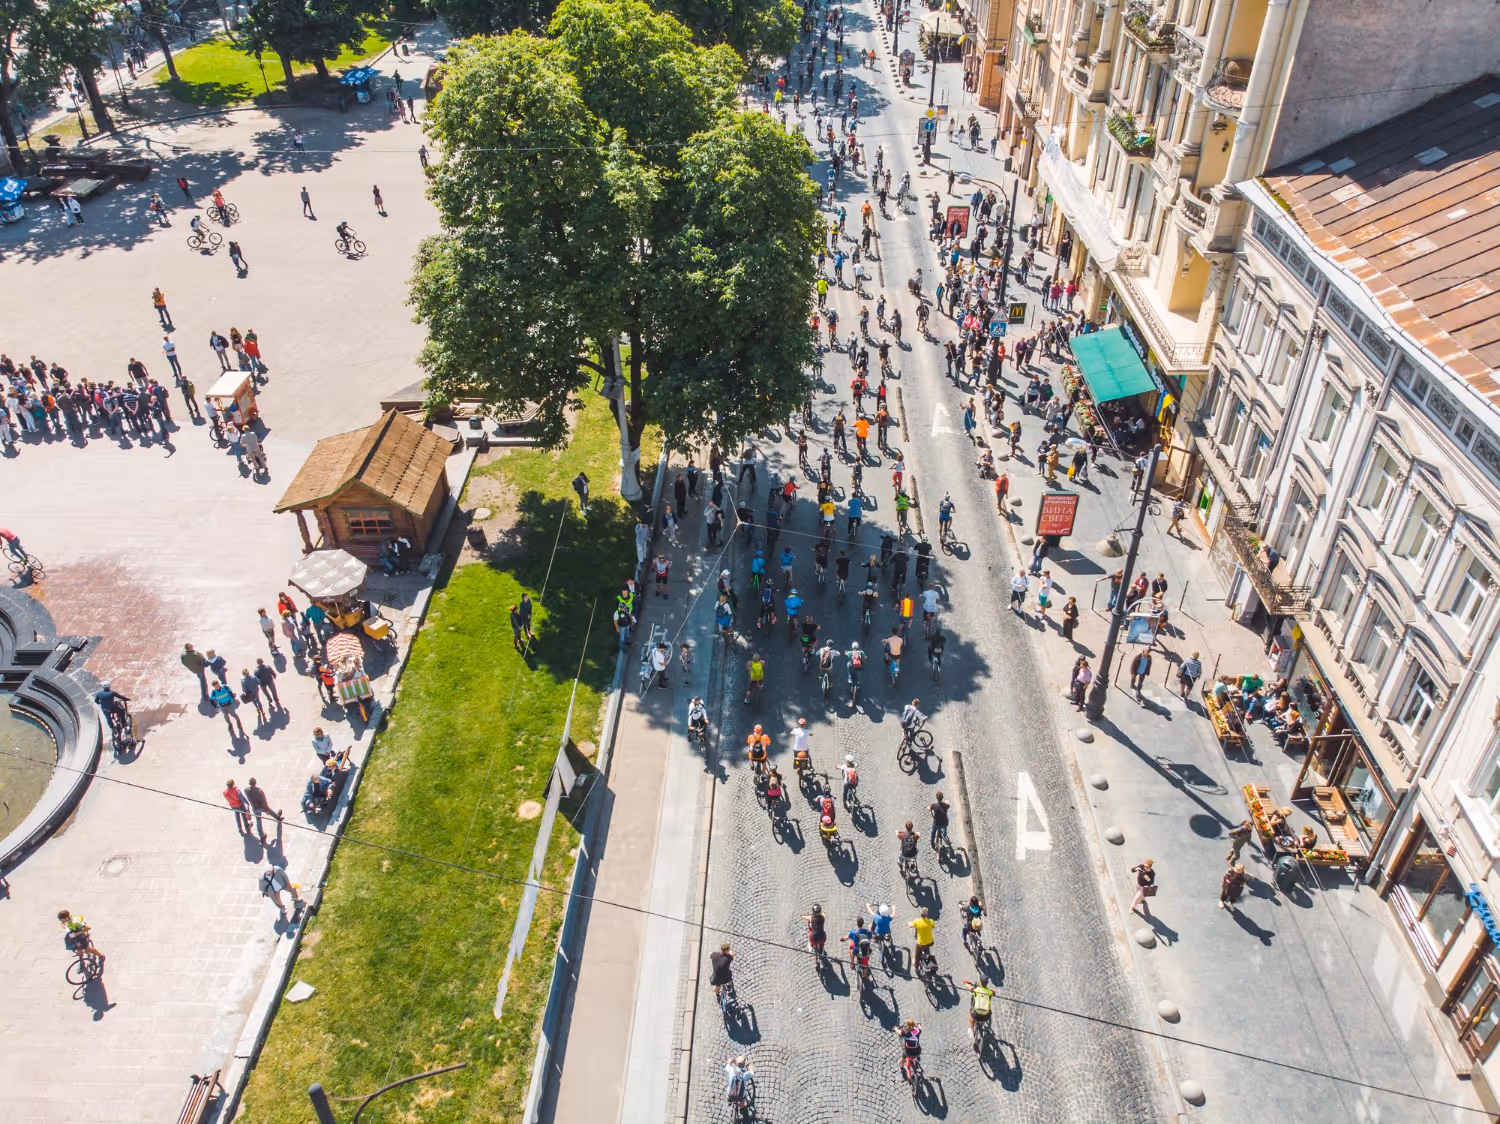
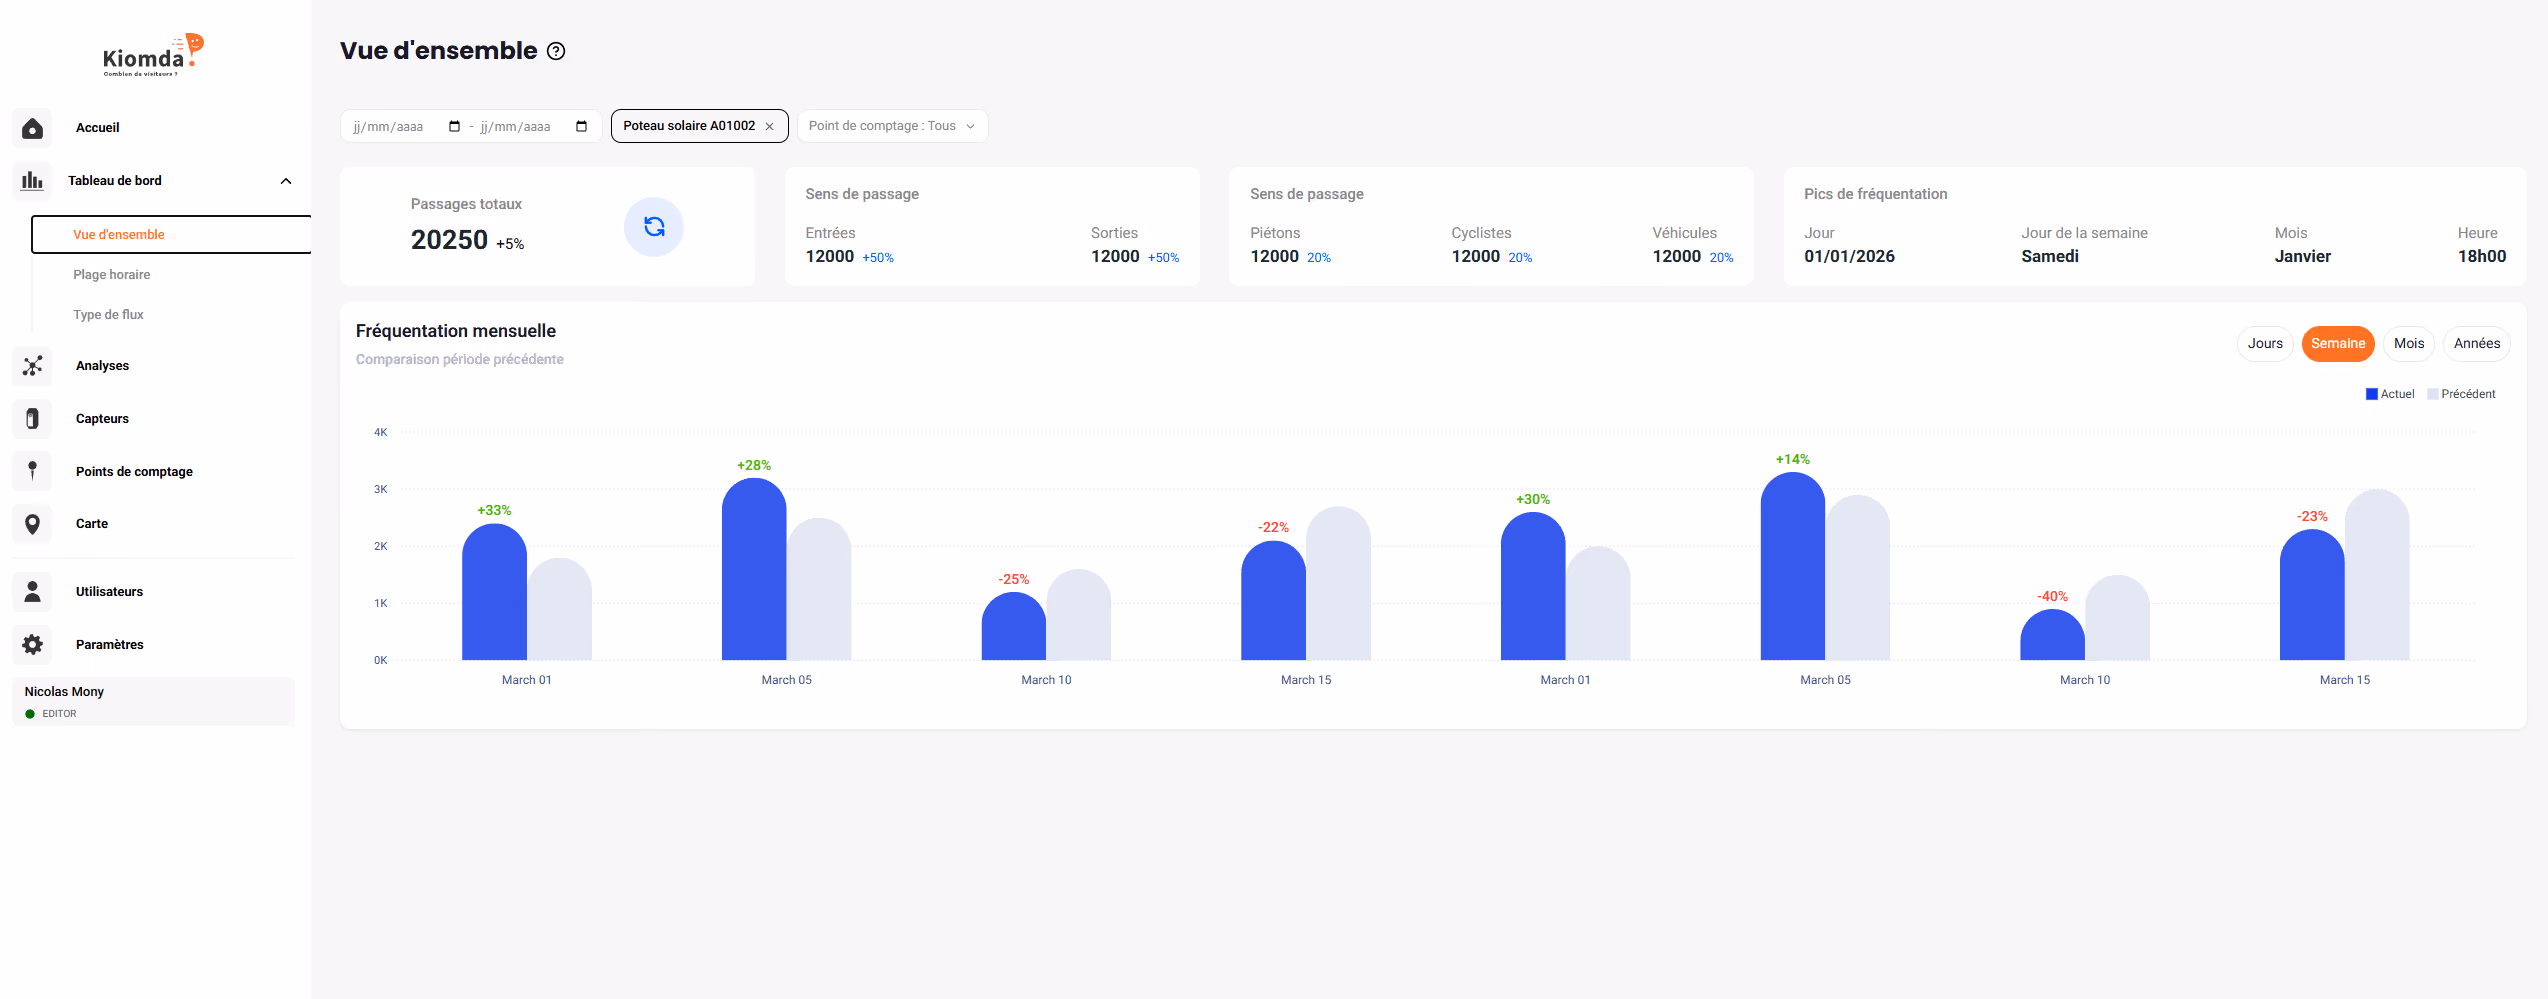
In many territories, mobilities are not isolated: pedestrians, cyclists and vehicles follow one another, intersect or use the same access. Sometimes in a shared space, sometimes in parallel circulations. The visual brings together the most common situations where several types of uses coexist — and where it becomes essential to know who is circulating, when and in what proportions.

compteur fréquentation multi mobilité
What is the proportion of cyclists on a hiking trail?
Objectify exceptional but structuring uses.
Who uses the site, when, and in what proportions?
See how trends converge in the same place.
How do trends coexist in a 20/30 zone?
Visualize the overall pressure and the variations according to the hours.
What is the real passage of vehicles in a space that is mainly cyclable?
Measure occasional motorized uses to adapt the layout.
When do the uses intersect the most?
Identify sensitive hours and the relative density of flows.
How are pedestrians and cars distributed at the entrance?
Understand spikes, conflicts of use, and the impact on security.

Why analyze several types of mobility?

In many sites, the uses are never homogeneous. Pedestrians, cyclists and vehicles sometimes travel in the same place, sometimes at different times, sometimes on parallel but interdependent paths. Without measurement, it is difficult to understand how these mobilities really combine: who uses the space, when, and in what proportions.

Espaces publics comptage piétons
How does vehicle counting work?

How do we get back exactly what you want to measure

Each site blends uses in its own way. Some want to know only pedestrians in an area where bicycles also pass; others want to isolate bicycles from a path shared with vehicles; still others want to compare “soft mobility” and “motorized” without going into the details of each mode.

Our approach consists in distinguishing the different types of passages, then recomposing the indicators according to your objective:

Pedestrians only, even in a mixed space.

Cyclists only, or cyclists + pedestrians (soft mobility).

Motorized vehicles, or vehicles + cyclists, depending on the use.

Soft vs motorized mobility for comparisons of use.

Aggregate flows (e.g. everything that passes through a given access).

Separate flows if the analysis needs to be detailed.

The challenge is not to count everything everywhere, but to produce data that corresponds exactly to the question you are asking yourself:

Who's going around? When? In what proportion?
In what dynamic over the seasons, hours or events?

This flexibility makes it possible to adapt the analysis to spaces that are sometimes shared, sometimes simply frequented by several modes at different times, without complicating your reading.

Customer cases

They trust us

logo client kiomda vallée de l'homme
Icon - Elements Webflow Library - BRIX Templates

Pedestrian/bicycle counting on the future greenway connected to Flow Vélo

Kiomda counters support us in the development of our greenway, called to join Flow Vélo. The data allows us to monitor attendance, to distinguish between pedestrian/bicycle uses and to inform our decisions in terms of tourism, investments and soft mobility. We note that the itinerary works well, with a high number of visitors in fine weather and not only carried by tourists.

Technical Services and Public Procurement Manager

Community of Municipalities of the Valley of Man (CCVH)
logo cc thonon
Icon - Elements Webflow Library - BRIX Templates

To assess the impact of new practices (mountain biking and trail)

Traffic monitoring allows us to improve facilities, to assess the impact of new practices (mountain biking and trail) to find the right balance between our ideas, the acceptance or not of our citizens as well as the expectation of overtourism.

This works well, information on attendance led us to change the space counters in winter to use them for a second activity: snowshoeing

Natural Areas Mission Manager - Alpage

Community of Municipalities of the Valleys of Thones
Association cas client Kiomda
Icon - Elements Webflow Library - BRIX Templates

Monitoring a place of pilgrimage (pedestrians + vehicles)

The municipality wants to measure attendance at a religious site accessible through three entry points. The count will be used to support a grant application and to better understand mixed flows. An adapted location makes it possible to obtain pedestrian and vehicle crossings, even if the road is two-way, by providing a reliable estimate of uses.

Friends of Saint Anthony
Niort agglo logo client compteur parking
Icon - Elements Webflow Library - BRIX Templates

Counting vehicles at the entrance of the car park

Installation of a unit dedicated to monitoring the attendance of a public car park. The data makes it possible to know the entrances and exits, to observe the periods of full occupancy and to facilitate the planning of services. The case is protected by an anti-vandalism cover to ensure its durability.

Niort Agglomération
Via Ardèche – Voie douce sur ancienne emprise ferroviaire
Icon - Elements Webflow Library - BRIX Templates

Via Ardèche — Soft road on former railway right-of-way

We use Kiomda meters to measure the attendance of a 5 km section built on an old railway line. The data makes it possible to demonstrate the value of the connection, to meet the requirements of funders and to better understand the uses (pedestrians/bicycles). They are used by elected officials as well as tourist offices to guide decisions and optimize services.

Project Manager - “Centre-Bourg” and “Small Cities of Tomorrow” Program

Communauté de Communes Val de Ligne
logo haute corrèze
Icon - Elements Webflow Library - BRIX Templates

Greenway “La Piste Verte” — 18 km between Cantal and Haute-Corrèze

The Kiomda counters finally allow us to objectify the attendance of the Green Track, a strategic axis to encourage modal shift. The data is used to demonstrate to funders the real use of the infrastructure and to better understand practices: schedules, volumes, type of users. We plan to exploit the data more finely and to extend the system to our 200 km of trails.

Nature Sports Project Manager/Proximity and Citizenship Department

Community of Communes of Haute Corrèze
logo client kiomda vallée de l'homme
Icon - Elements Webflow Library - BRIX Templates

Itinerant monitoring of soft and motorized mobility

The city uses a mobile box to measure bicycle, pedestrian and vehicle crossings on several sites: bike path, greenway, communal street. The data revealed more than 200 daily crossings on an axis where ten times fewer were expected. The itinerant solution makes it possible to test new routes, document the usefulness of developments and support local mobility policy.

City of La Ferté Saint Aubin
Icon - Elements Webflow Library - BRIX Templates

Why analyze several types of mobility?

In many sites, the uses are never homogeneous. Pedestrians, cyclists and vehicles sometimes travel in the same place, sometimes at different times, sometimes on parallel but interdependent paths. Without measurement, it is difficult to understand how these mobilities really combine: who uses the space, when, and in what proportions.

How to count pedestrian traffic
Objectifying interactions between modes

Cohabitation can seem fluid or conflicting at different times: measuring each use separately shows where and when interactions become sensitive.

Prioritize facilities and safety

To choose what to secure, where to appease or which mode to choose, you need to know the real part of each flow. Impressions are not enough to arbitrate.

Understand hourly and seasonal variations

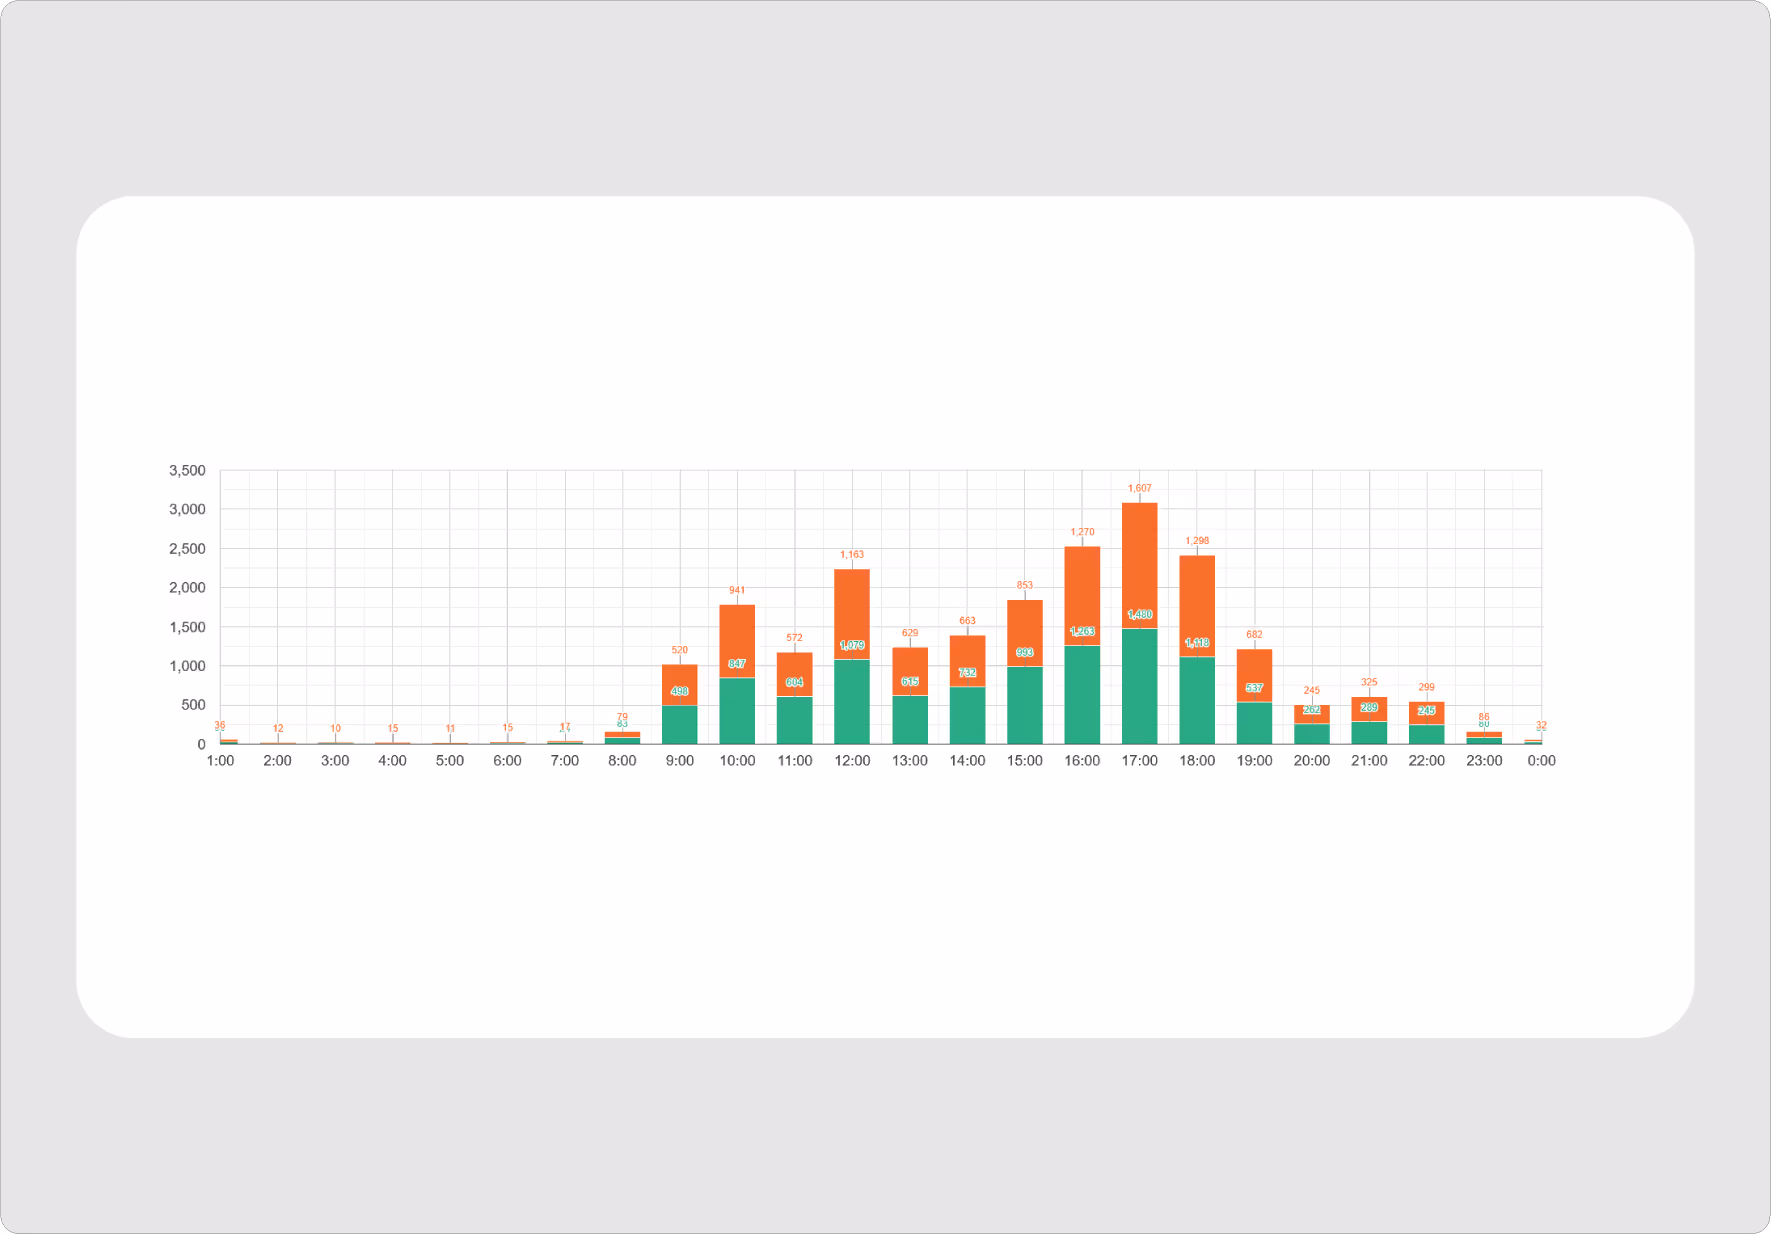
Some modes dominate in the morning, others at the end of the day, others at the weekend or during the tourist season. Separating uses makes it possible to identify these rhythms.

Documenting uses to support a decision

The distinction between modes sheds light on applications from elected officials, technical services or funders: soft, motorized, mixed mobility... each category has its own impact.

Verify the performance of a layout

Bicycle path, greenway, peaceful area: distinguishing who is really using the space makes it possible to assess whether the development is achieving its objective or if an adjustment is necessary.

Make what is mixed up in appearance legible

In many places, cohabitation seems homogeneous, although it varies greatly depending on the time of day or mode. The measure reveals these nuances and avoids hasty conclusions.

Compteur de passage parking
Route compteur de passage voiture
Compteur de passages voitures parking entreprise

A lightweight solution designed for local motorized traffic

Motorised contexts do not always require heavy systems. Verdilo provides a simple, autonomous approach to measure vehicle passages in controlled accesses, car parks, narrow streets and shared routes. Its technical characteristics are designed to deliver reliable, actionable data that is quick to deploy — with no civil works and no power supply.

Icone batterie

Autonomous

Works without power supply (Autonomy estimated at more than 2 olds).

Icone portée étendue

Light installation

Set up in 2 minutes, with no expertise required, delivered ready to use.

Icone solide

Robust

Designed for outdoor conditions, in natural or urban environments.

Compteur discret

Anonymous data

No images saved, RGPD compliance.

compteur double sens

Bidirectional & mode distinction

Clear reading of the directions of passage and differentiation between pedestrians, cyclists and vehicles.

accès simple aux données de fréquentation lightbulb

Easy access to data

Online consultation or local survey in remote areas.

Concrete use cases where distinguishing between modes changes everything

Compter les passages dans les espaces publics

How to measure attendance without cameras or civil works?

Discover our complete guide to choose the right solution for your public spaces.

Request a personalized quote

Each site is different — we help you choose the easiest and most reliable configuration.

1
2
3

Build your counting project in a few clicks

1
2
3

Tell us about your project

Add here all the details you think are useful: specific context, objectives, constraints...

1
2
3

Your contact details

For our team to analyze your project, and contact you quickly to finalize your project with a quote.

Previous
Next
Form completed

Thanks! Your project has been saved successfully

Our team will contact you very quickly to deepen your needs and build an adapted proposal.

Oops! Something went wrong while submitting the form.