.avif)


English
Occupancy rate, peaks, rotation, typical days: follow a car park with a simple method. Field advice and pitfalls to avoid with entry/exit counting.
Occupancy is controlled from reliable entries and exits, read by time slot. To reconstitute a presence gauge, it is necessary to distinguish the meaning (inputs vs outputs) and to instrument the accesses actually used. Finally, the quality depends more on the terrain and the pose than on the “material”: fluid flow, well-chosen location, and stable detection conditions.

Before talking about sensor or dashboard, you need to clarify your objective. Many projects start from a simple request — “measuring occupancy” — but in reality they cover three different concepts.
Attendance corresponds to the volume of vehicles entering (or leaving) over a period of time. Occupancy, on the other hand, describes the level of occupancy, i.e. the presence of vehicles at a given time or by time slot. Finally, rotation expresses how many times a space is used over a period of time: it is often the most interesting indicator in the city center or in a car park with high turnover.
In the majority of “open” car parks (without an automated parking system), occupancy is measured in a robust manner by a simple method: counting entries and exits, then reconstructing a presence gauge over time. This assumes a count capable of distinguishing the direction of passage, and time-stamped data that is sufficiently accurate to see the variations of the day.
.avif)
The right method is to first secure the quality of the signal and then to produce readable indicators.
Start by defining your real perimeter. Does your car park have a single entrance/exit, two main accesses, or secondary entrances (residents, deliveries, drop-offs, technical access)? This step is decisive: if you do not capture the accesses that concentrate most of the passages, you will not measure occupancy, but a partial trend.
Next, choose an instrumentation strategy. The ideal case is a naturally “bottleneck” crossing point, where all vehicles pass. In this case, a well-placed counting point may suffice. If you have two accesses that are actually used, you generally need two points. If the car park is very permeable, with several openings that are difficult to channel, the exact occupancy becomes complicated: you can either multiply the measurement points, or assume a “trend” monitoring of use (comparisons, peaks, before and after), but this must be clearly stated in your report.
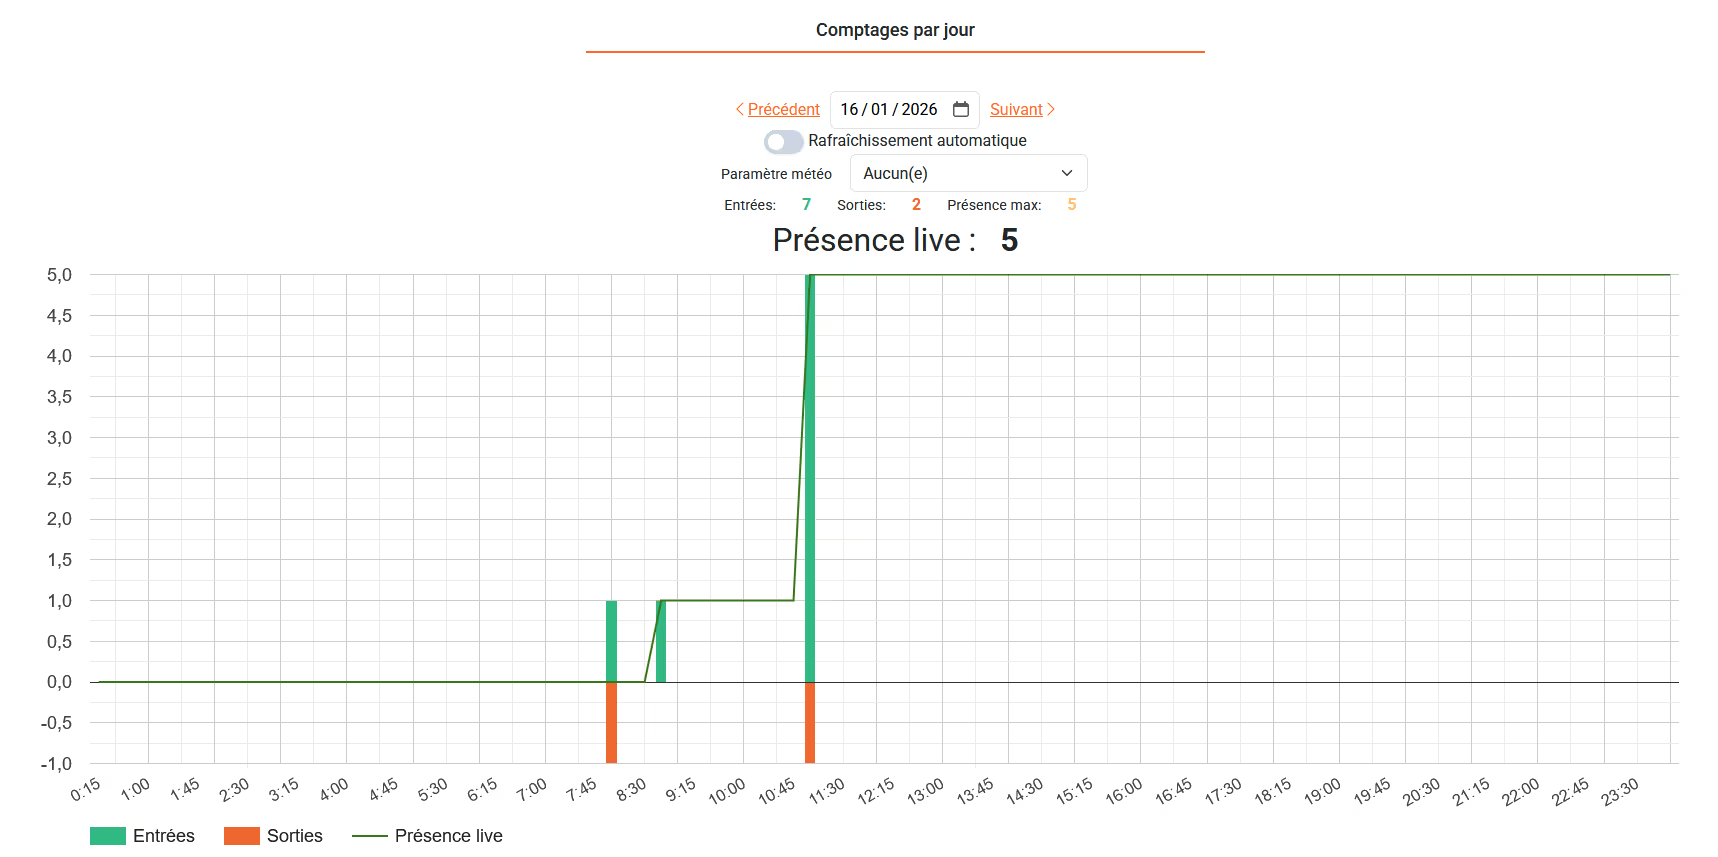
Once the accesses have been controlled, the objective is to obtain entries and exits by time interval (hour, half hour, quarter of an hour depending on the need). This makes it possible to reconstitute a presence gauge progressively: at each slice, the inputs are added and the outputs are removed. In a dashboard, this gauge becomes your “estimated occupancy” and makes it possible to identify periods of tension.
Last step: you compare the estimated gauge with a reference capacity. Capacity may be the official capacity of the car park, or a “useful capacity” defined by the operation (for example, the threshold at which queues become problematic or internal traffic deteriorates).
Good parking monitoring is more than “full/not full”. It should make it possible to decide.
The first useful indicator is the schedule profile: how the car park fills up and empties on a typical day. This highlights peak hours, off-peak periods, and atypical days. From there, you can follow the peak of occupancy (the maximum over the day), but also the periods of saturation, i.e. the length of time during which the car park remains above a critical threshold.

Then come the comparison indicators: working days vs weekends, school periods vs vacations, low season vs high season. It is these comparisons that make it possible to objectify a decision, for example the interest of a P+R, the effect of a new transport offer, or the impact of a price change.
Finally, if your challenge is city center or business, rotation becomes central. A “full” car park is not necessarily an “efficient” car park: a full car park with low turnover can indicate long-term parking that penalizes access. Conversely, a moderate average occupancy rate can be perfectly satisfactory if the rotation is good and if the use corresponds to the objective.
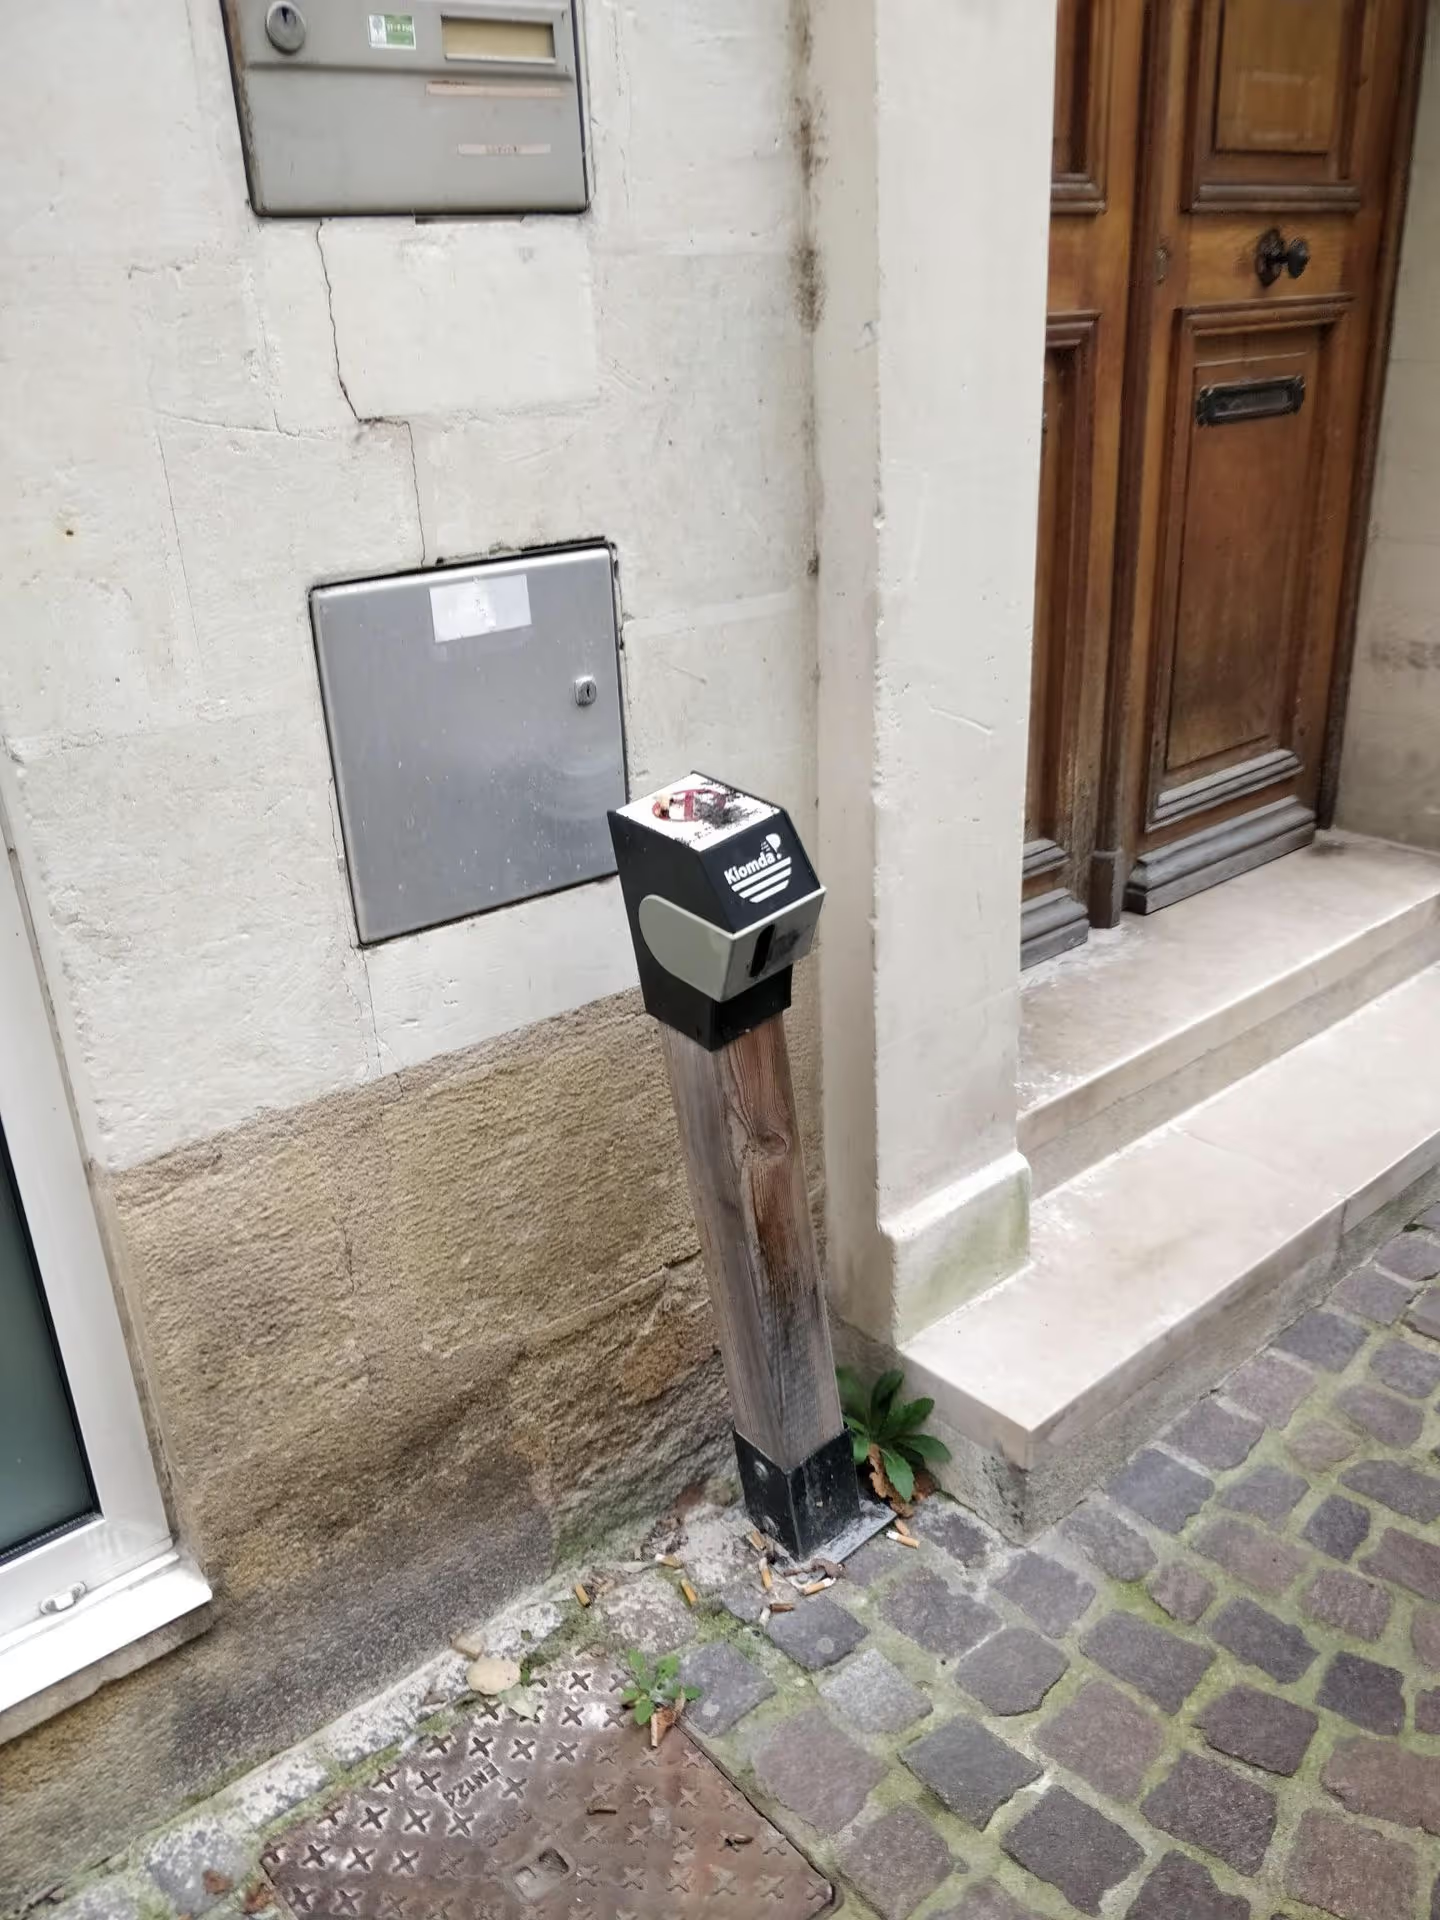
Verdilo is relevant to the parking theme in a specific scenario: measuring entries and exits on one or more access points, then exploiting the data on a platform. The ability to distinguish the direction of passage is a key condition for calculating an estimated occupancy based on entrances/exits.
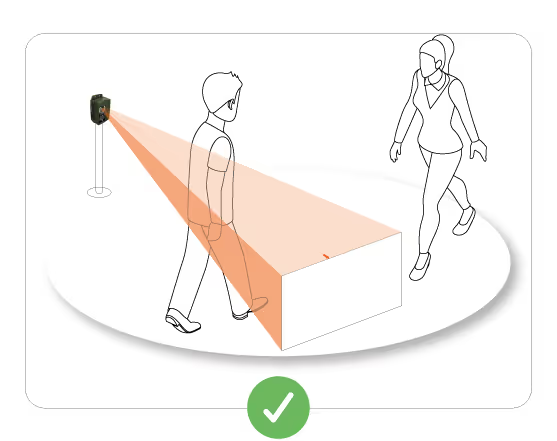
To obtain a reliable result, the crossing point must be as “clean” as possible. Ideally, vehicles pass through a natural corridor (gate, barrier, access road) or a canalized passage. The larger the site, the more dispersed the trajectories are, the more the risk of imprecision increases. Another important point is the stability of the detection conditions: areas where vehicles stop for a long time, make complex maneuvers or intersect in clusters are avoided as much as possible. It is not “serious” if this happens from time to time, but if it is the nominal functioning of the site, the measurement becomes less reliable.
On the operational side, you must choose a data feedback frequency adapted to your use. For a “controlled” car park (traffic management, seasonal tension, tourist resort), a more regular lift is relevant. For an “observatory” car park (diagnosis, study, assessment), a less frequent lift may suffice. The main thing is to align the settings with the need, because the transmission frequency affects the autonomy.
The most common mistake is to want to measure precise occupancy without instrumentalizing the accesses actually used. If you only catch one entry out of three, you are producing an indicator that can be useful in trends, but should not be interpreted as a reliable gauge. In this case, you either add measurement points or you reformulate the objective and clearly document the perimeter.
The second mistake is not distinguishing between inputs and outputs. Without meaning, you can't piece together a presence gauge. In a car park, it is a methodological prerequisite, not an option.
Third mistake: install on a point where the flow is not smooth. If the access is an area of U-turns, drop-offs, extended stops, or permanent crossings, it is often preferable to move the measurement point a few meters upstream/downstream to find a simpler passage.
Finally, a common mistake is to ask for “real time” without defining the use. The question to be answered is simple: do you want to drive during the day, or do you want to analyze after the fact? The settings should follow this intention.
Once the accesses are instrumentalized and the estimated gauge calculated, the data becomes actionable. You can identify peak hours and adapt user information, signage, and even overflow management. You can compare periods to objectify the effect of a change (works, pricing, creation of a bike path, new transport service). And you can produce clear reports for elected officials, managers or partners, with simple indicators: hourly profile, peaks, typical days, periods of saturation, before and after.


.svg)