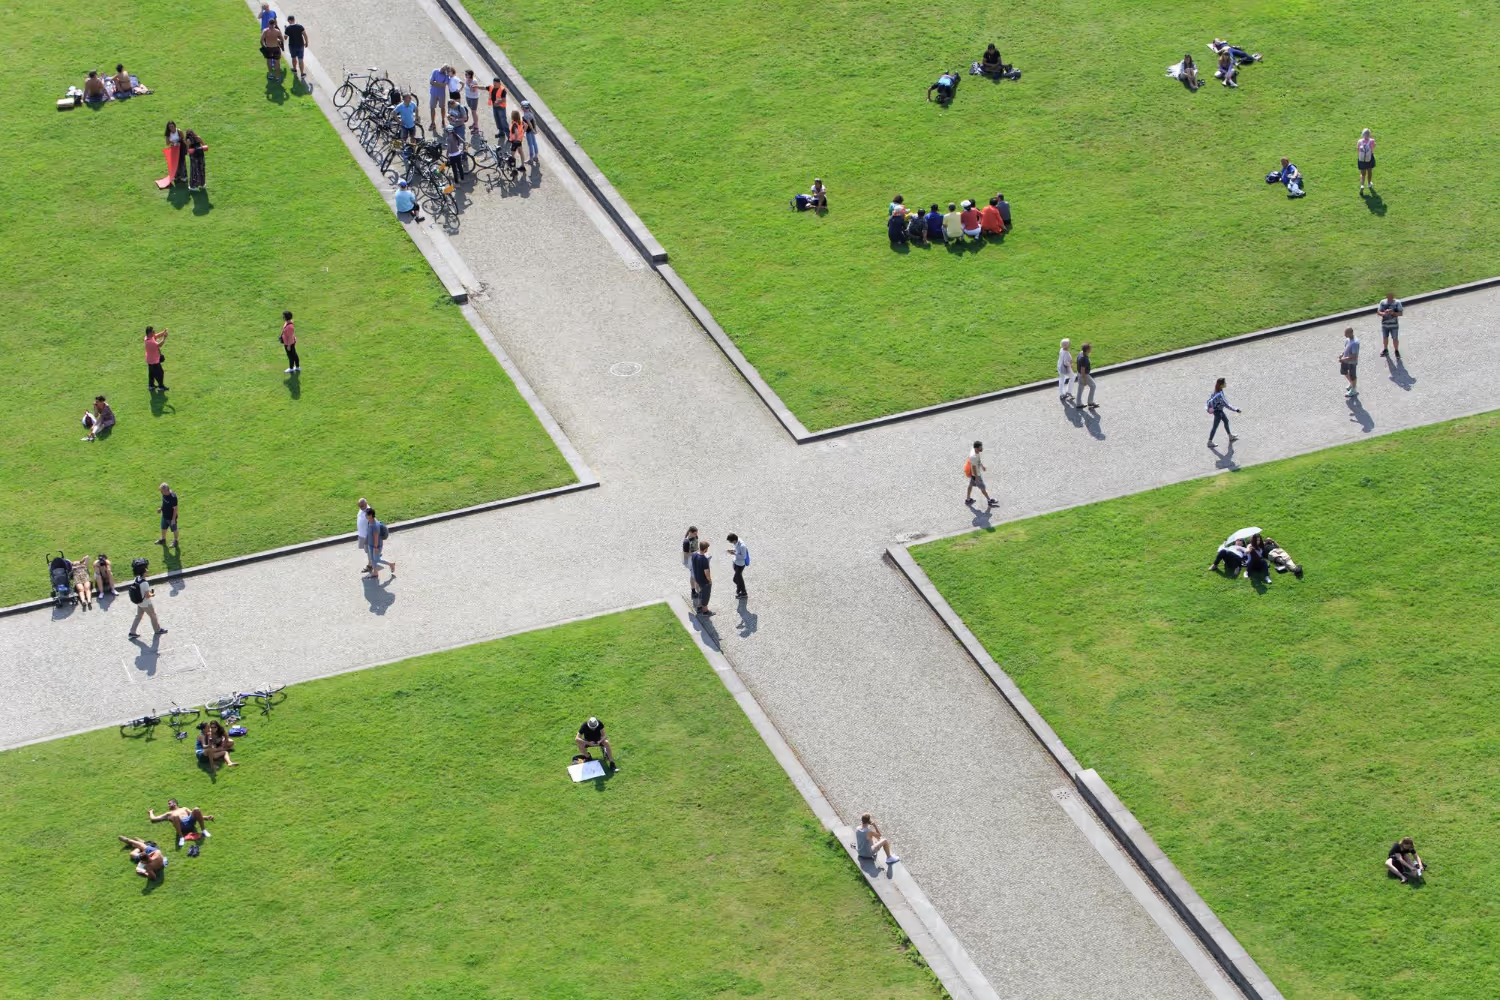
Each site hosts very different pedestrian uses: park entrances, natural trails, public buildings, shopping streets, events or narrow passages. Each raises specific questions: human pressure, attractiveness, peak hours, temporary saturation or seasonal evolution. The examples presented here are not exhaustive, but they illustrate the diversity of situations in which pedestrian data brings clarity — and show how a single solution can adapt to a wide range of configurations.

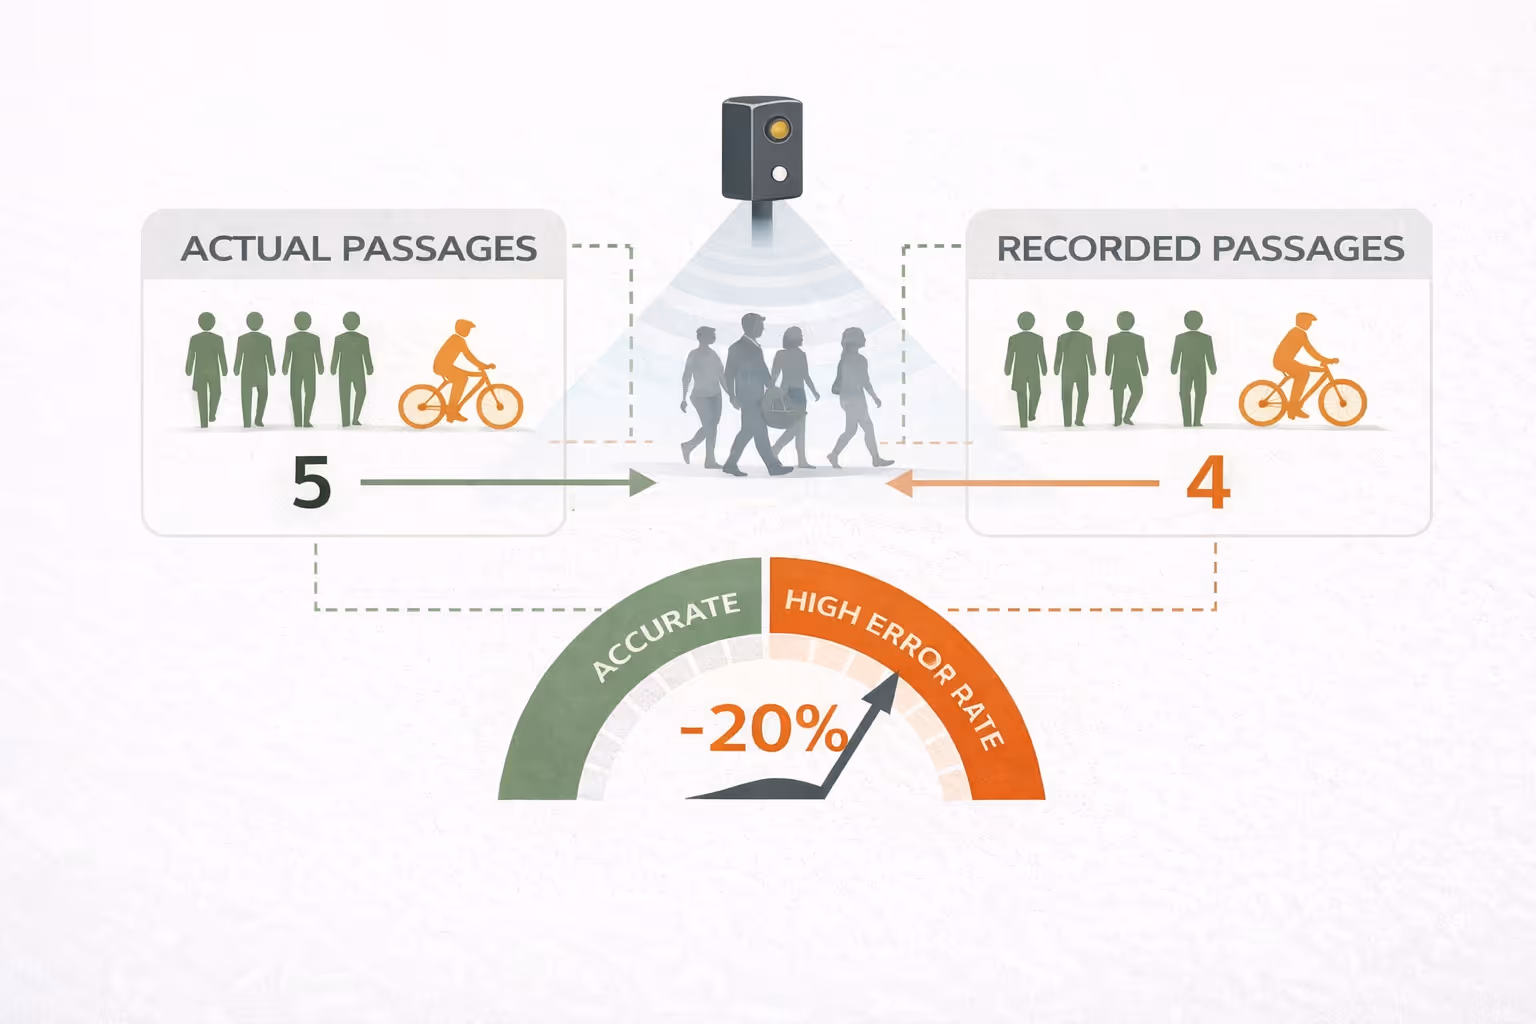
Pedestrians never move in a strictly linear way: they change pace, stop, observe, change direction.
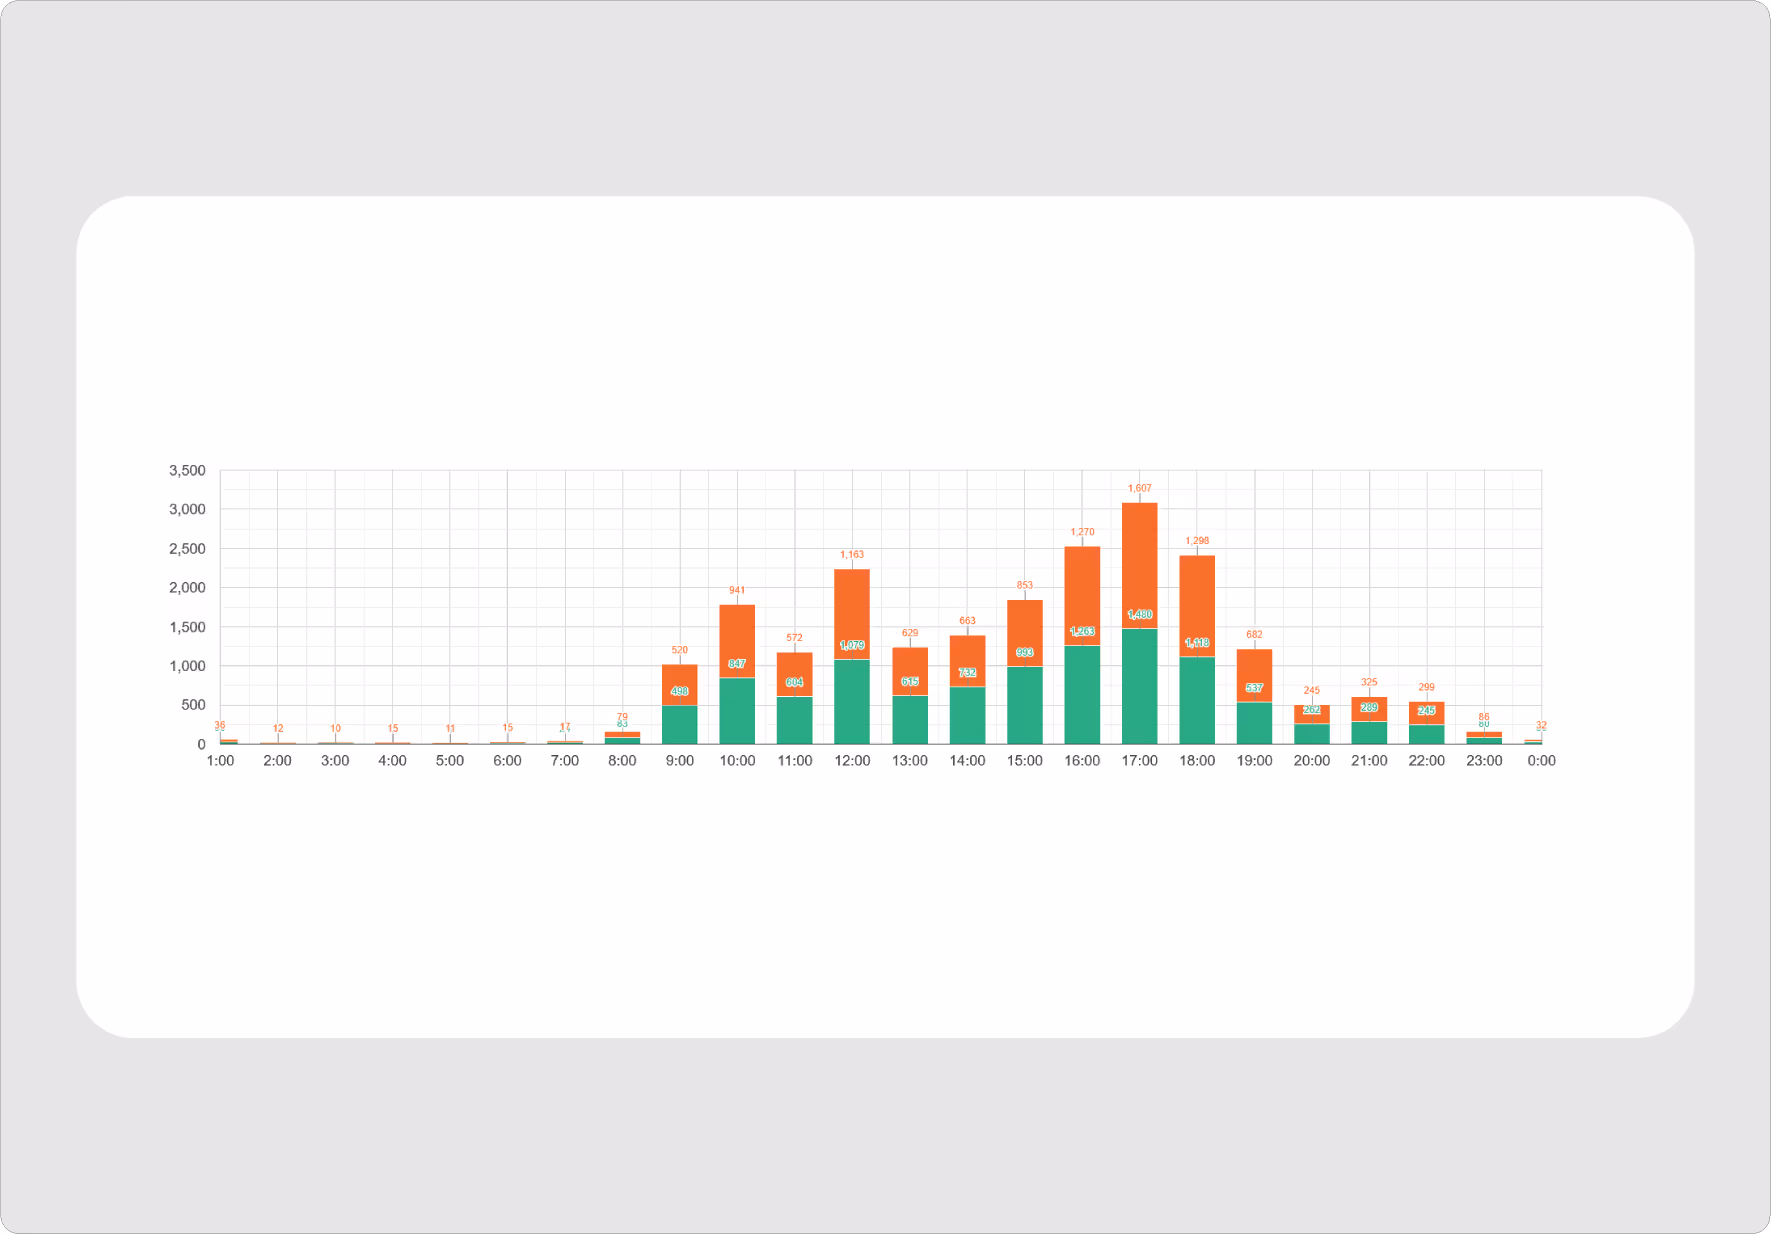
These variations do not make measurement impossible; they make it necessary. Even in complex environments, pedestrian flows generate stable and actionable trends: hourly peaks, pressure on natural sites, city-centre attractiveness, or temporary saturation during events.
With the naked eye, some periods are underestimated and others overestimated.
These behaviours distort perception — yet they directly affect maintenance, safety, preservation strategies and the capacity management of a site.
This is a legitimate question. In most cases, the answer is yes — provided a natural point of passage can be identified: an entrance, a narrowing, a corridor, a gate or any area that channels flows, even imperfectly.
Our role is to analyse your configuration, identify this point and adapt the sensor setup accordingly: mounting height, orientation, angle or specific settings. Some situations require fine-tuning — very dispersed flows, frequent groups, multiple trajectories — but we have the necessary options to obtain usable data.
The goal is not to track individuals, but to measure usage trends that structure attendance on your site. Based on this, we recommend the most appropriate configuration.
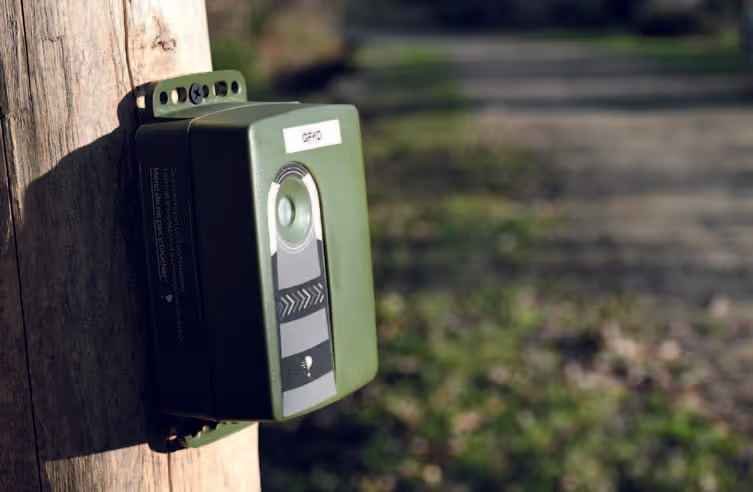
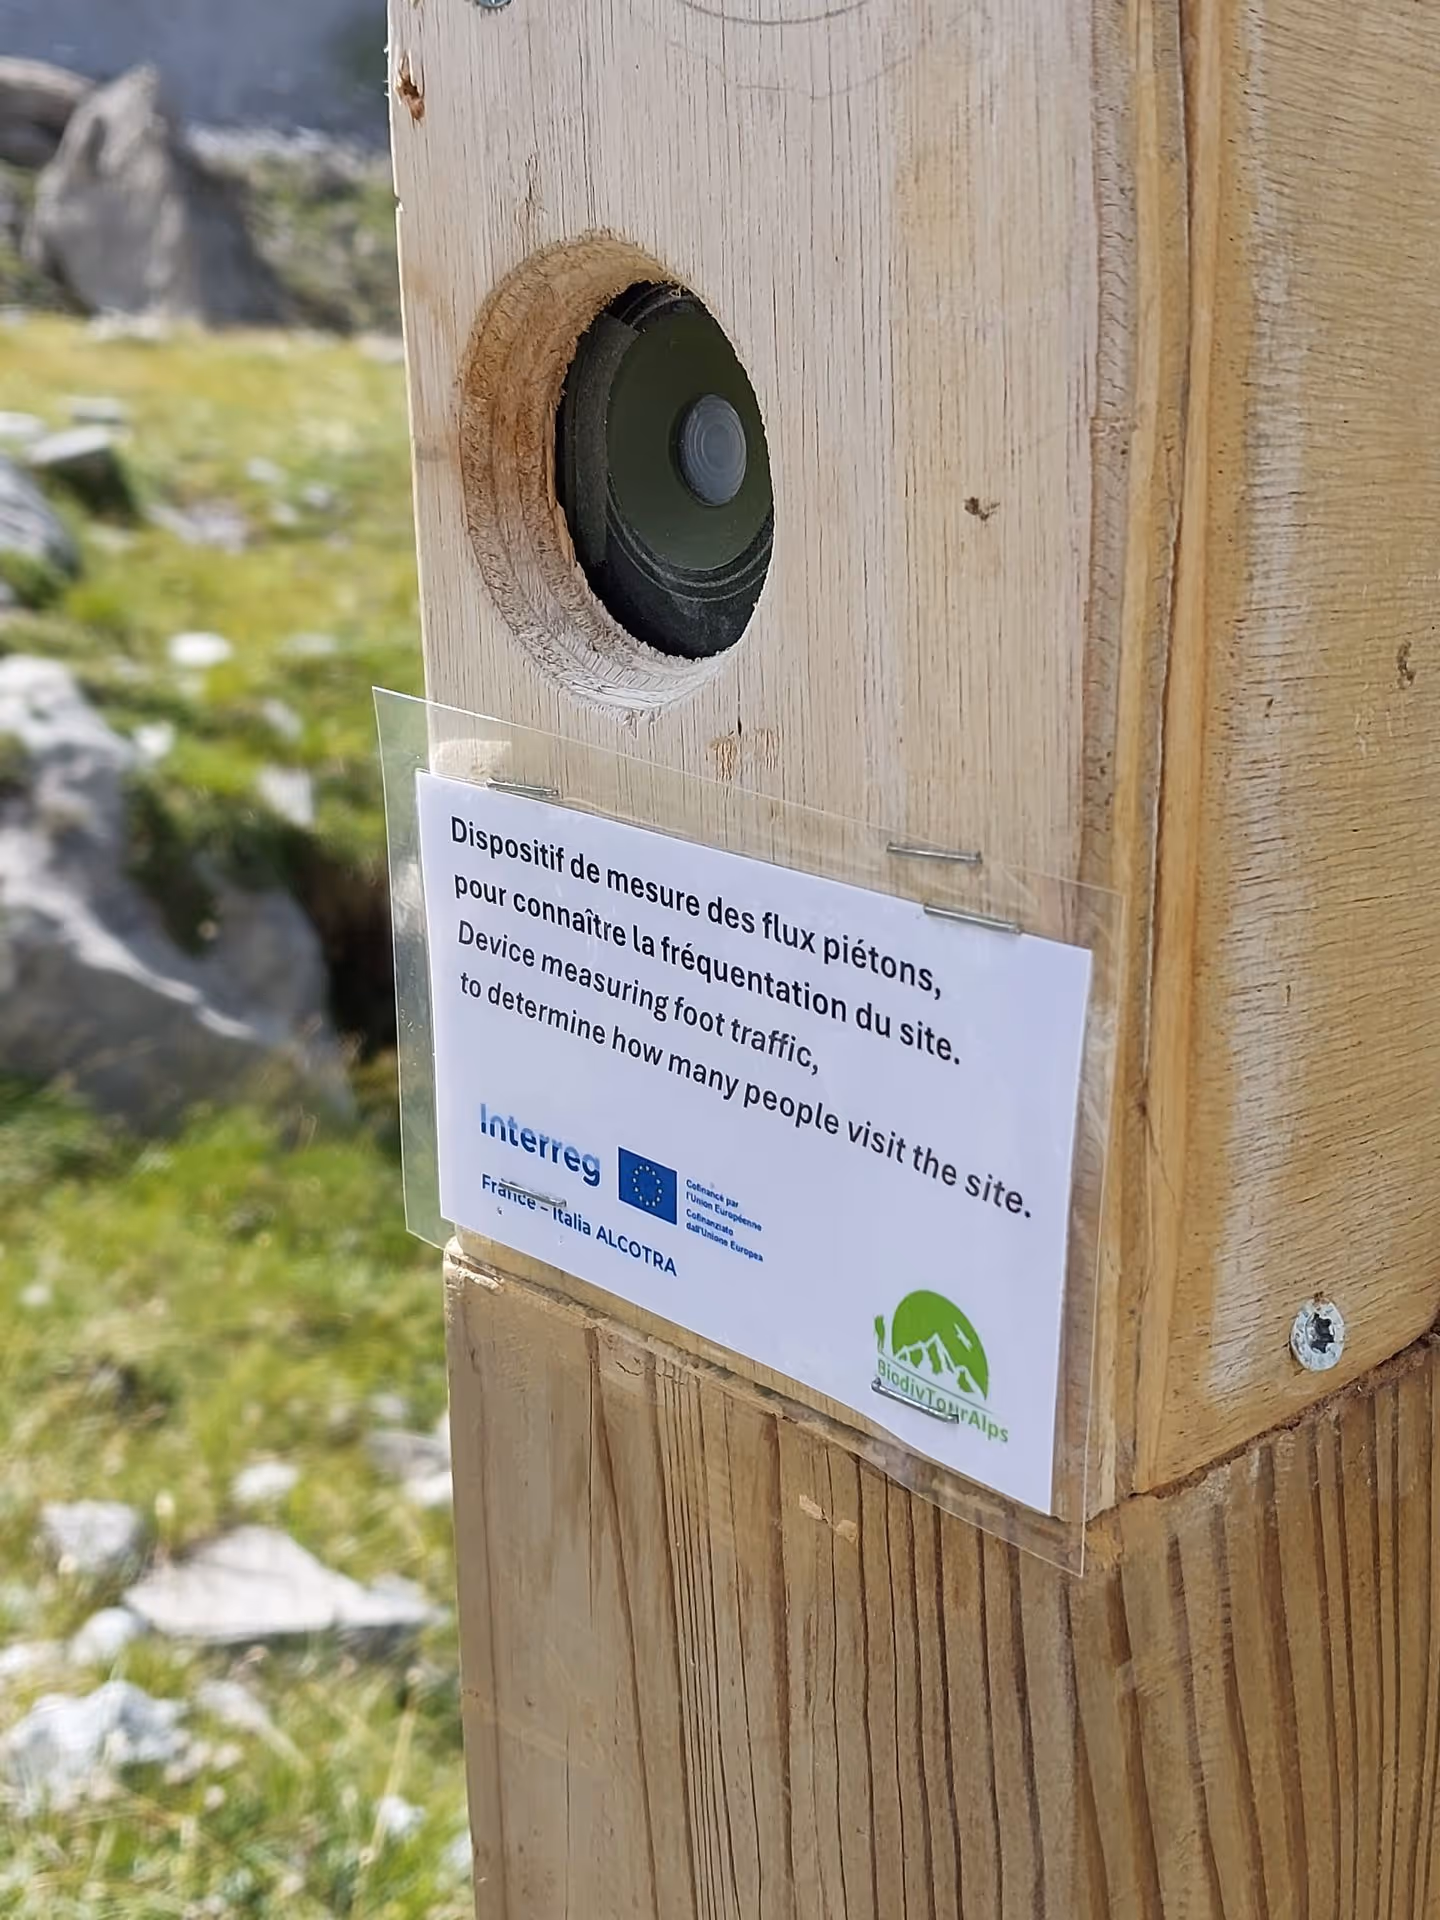
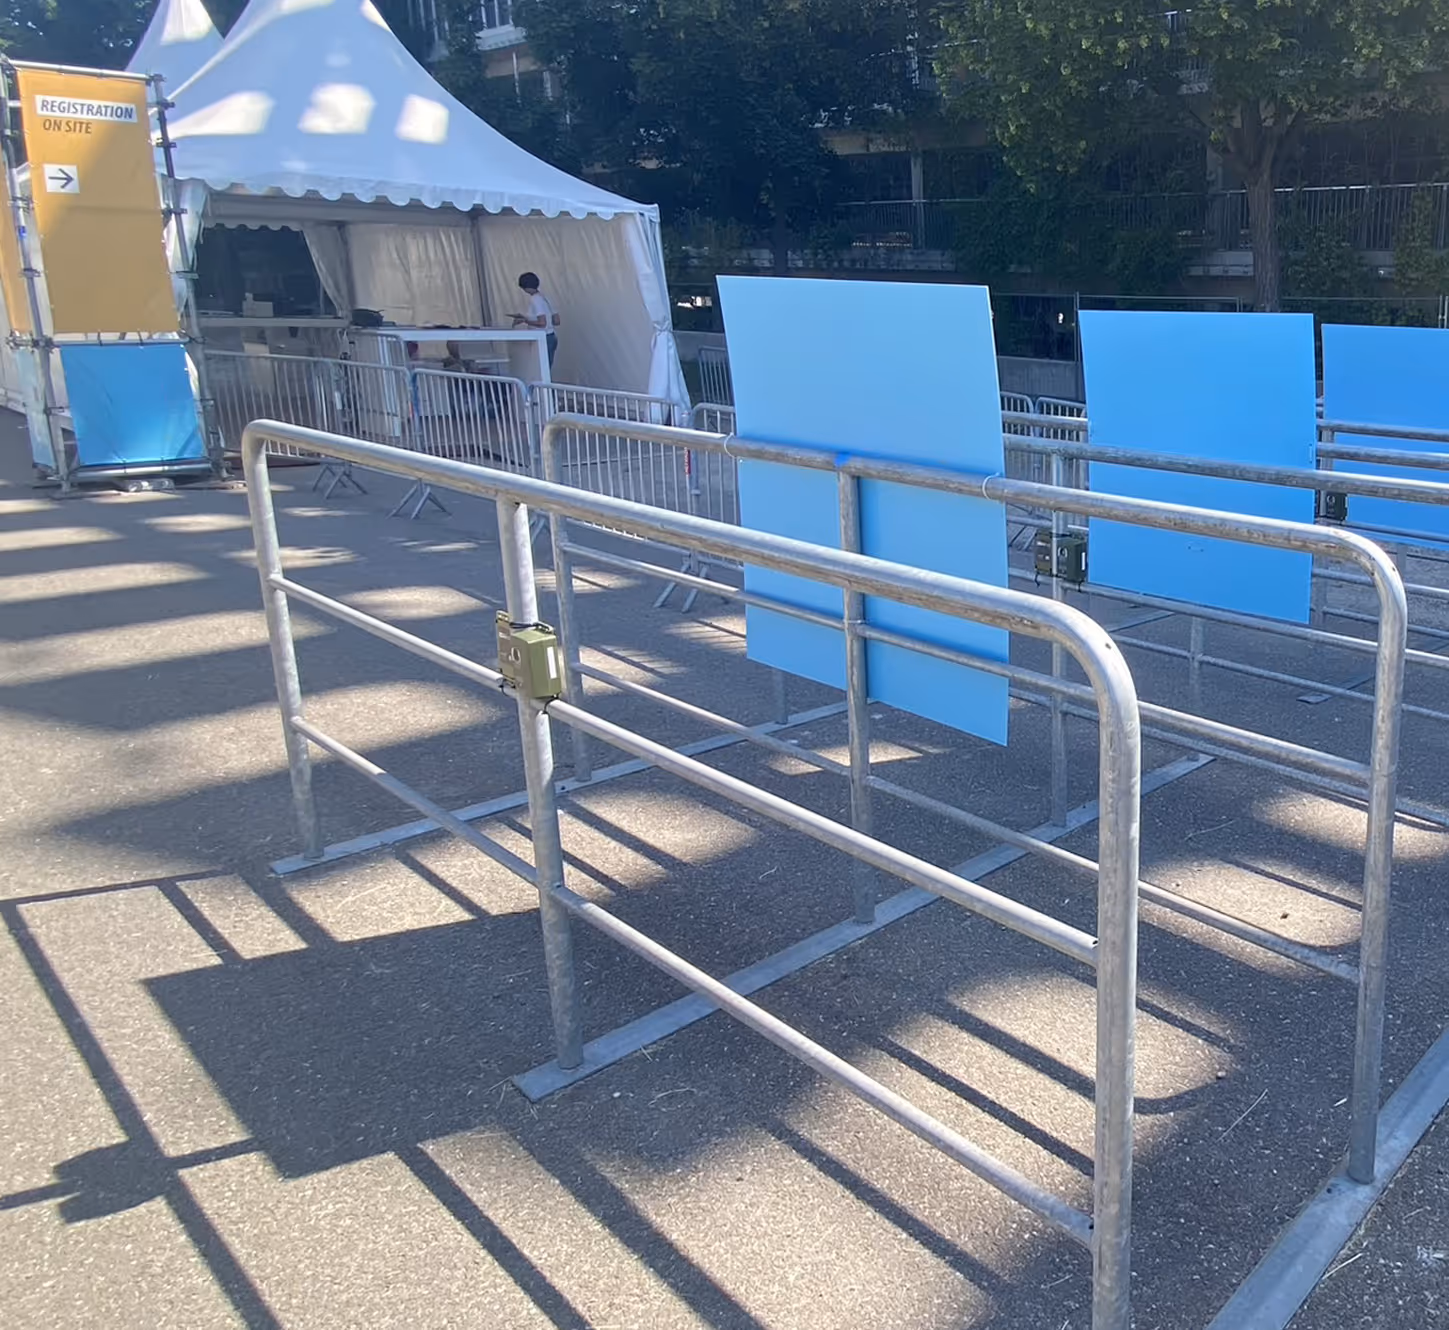
The Verdilo counter uses advanced thermal detection technology to automatically count pedestrian passages in both directions.

The aim of measurement is never to “make a number.” It is used to support concrete decisions.
Operational decisions based on real usage
Data to justify and defend projects
See what the eye cannot
Testimonials
We had identified vulnerable sites, we could almost talk about overcrowding on these sites. Having this data allows the work to set up experiments to preserve spaces (adapted mobility systems, for example by setting up shuttles)
We have a long way through a sensitive natural area, which could potentially create a disturbance for local wildlife. So we needed transit data to know if we needed to implement access restrictions.

Every morning, our agents consult the Kiomda platform to monitor the attendance of the recycling center. Daily and time slot data allow us to adapt summer/winter schedules and compare incoming tonnage to the number of visitors.
The system has replaced manual counting, with a real gain in reliability. We can now justify the presence of several agents on site — up to 500 users per day in Biscarrosse — and fill out our regulatory records accurately.

We have created a soft link parallel to a departmental road, and the department subsidizes it so we have to send it regular figures.
We didn't expect a peak in usage on Tuesday after 22:00, until we understood that the local soccer team went back and forth from their weekly training through our gentle liaison. We would not have learned it without the installation of counters.
Since the installation of the visitor counter in the castle park, we have a tool that allows us to have factual information, day by day, in order to respond to our partners on the number of visitors to the city. This also allowed us to set up new actions: deckchairs, provision of bicycles for children and the park became a place for exhibitions and events during the summer season (concerts, theater, guided tours).

Traffic monitoring allows us to improve facilities, to assess the impact of new practices (mountain biking and trail) to find the right balance between our ideas, the acceptance or not of our citizens as well as the expectation of overtourism.
This works well, information on attendance led us to change the space counters in winter to use them for a second activity: snowshoeing

Among other things, we manage tourist trails for the Conservatoire du Littoral, and these trails are designed for the public. Attendance figures help us make decisions. We used this data to prioritize areas: by understanding what are the main entry points on the trails, or the busiest points, we can decide where to involve our technical services.

Finally, the Verdilo meter allows us to precisely measure the number of visitors to the garden and to follow its evolution over the seasons. The data is used by us as much for security, the management of events as for the promotion of the site with our partners.
We are very happy with this solution. In addition, it is a French company, with a particular customer relationship, and a great listener. It is becoming more and more rare today.

The data alerted us to the frequency of use of certain portions of the site, which therefore require interventions by technical teams in order to ensure the conditions of use in complete safety - the need for grooming the slopes may be more frequent if they are more frequented.

On a coastal path, the automated counting of passages makes it possible to estimate attendance as accurately as possible, which makes it possible to justify the investments made to the general public and elected officials, and also to estimate the erosion and degradation of the trail by the passage of pedestrians. Finally, this makes it possible to better calibrate requests for public subsidies.
The counters make it possible to estimate the attendance of 5 natural tourist sites and to measure the pressure that these sites are under due to the numerous visitors. It is a quantitative arbitration basis that allowed us to refine our plan for the management of natural tourist sites.
.avif)
We use the box to know the site's attendance rate. We are asked for figures through elected officials. It's very complicated to count the people who come in and out, the site is a kind of big garden.
The Ecofarm de la Barre has existed since 2000, it was closed to the public before, we only worked with groups and schools. In 2020, the site was opened to the public. It was on this occasion that the association equipped itself with the counter.

We use Verdilo boxes on summer pools to monitor attendance. The old pools did not meet the obligation of Instant Average Attendance (F.M.I.), which requires knowing the number of bathers present at any time. Thanks to the sensors, we have a reliable estimate to meet this requirement and manage attendance remotely. It is a simple, effective tool adapted to our needs. We are completely satisfied.

Lake Charpal is both a drinking water reservoir and a tourist site. The community of municipalities of the Coeur de Lozère, the ARS and the State wish to monitor its evolution in attendance. As the site has several accesses, the Kiomda mobile box is particularly suitable. Data helps guide our decisions. For example, they are used to assess the relevance of installing one or more chalets for walkers, without going beyond what is necessary. We are very happy with the solution.


%202.avif)

The Verdilo counter is designed for varied configurations, outdoors and in remote locations, without civil works or infrastructure. The following features ensure stable data and simple day-to-day use.
Works without power supply (Autonomy estimated at more than 2 olds).
Set up in 2 minutes, with no expertise required, delivered ready to use.
Designed for outdoor conditions, in natural or urban environments.
No images saved, RGPD compliance.
Separately identifies pedestrian, cyclist and vehicle passages, depending on configuration.
Online consultation or local survey in remote areas.
Pedestrian uses vary by location type: natural areas, urban parks, city centres, public facilities or temporary events. In each context, measurement provides precise insights to better manage attendance, anticipate pressure and support operational decisions.
Each site is different — we help you choose the easiest and most reliable configuration.


.svg)