When a manufacturer announces 98% accuracy for its sensor, this value almost always corresponds to measurements made under optimal test conditions: only one user at a time, constant speed of passage, ideal installation height, ideal installation height, neutral weather conditions. These are conditions that are rarely encountered in real use, in particular on high-traffic routes or in natural environments.
Counter accuracy is not a fixed value. It is a performance range that evolves according to the environment, the context of use and the quality of the installation. Understanding this nuance is essential to properly assess a solution, compare offers and set realistic expectations for your attendance measurement project.
The real question is not “does this sensor achieve 97 or 98% accuracy?” but rather: “under what conditions is this precision guaranteed, and how does the sensor behave when these conditions are not met? ”
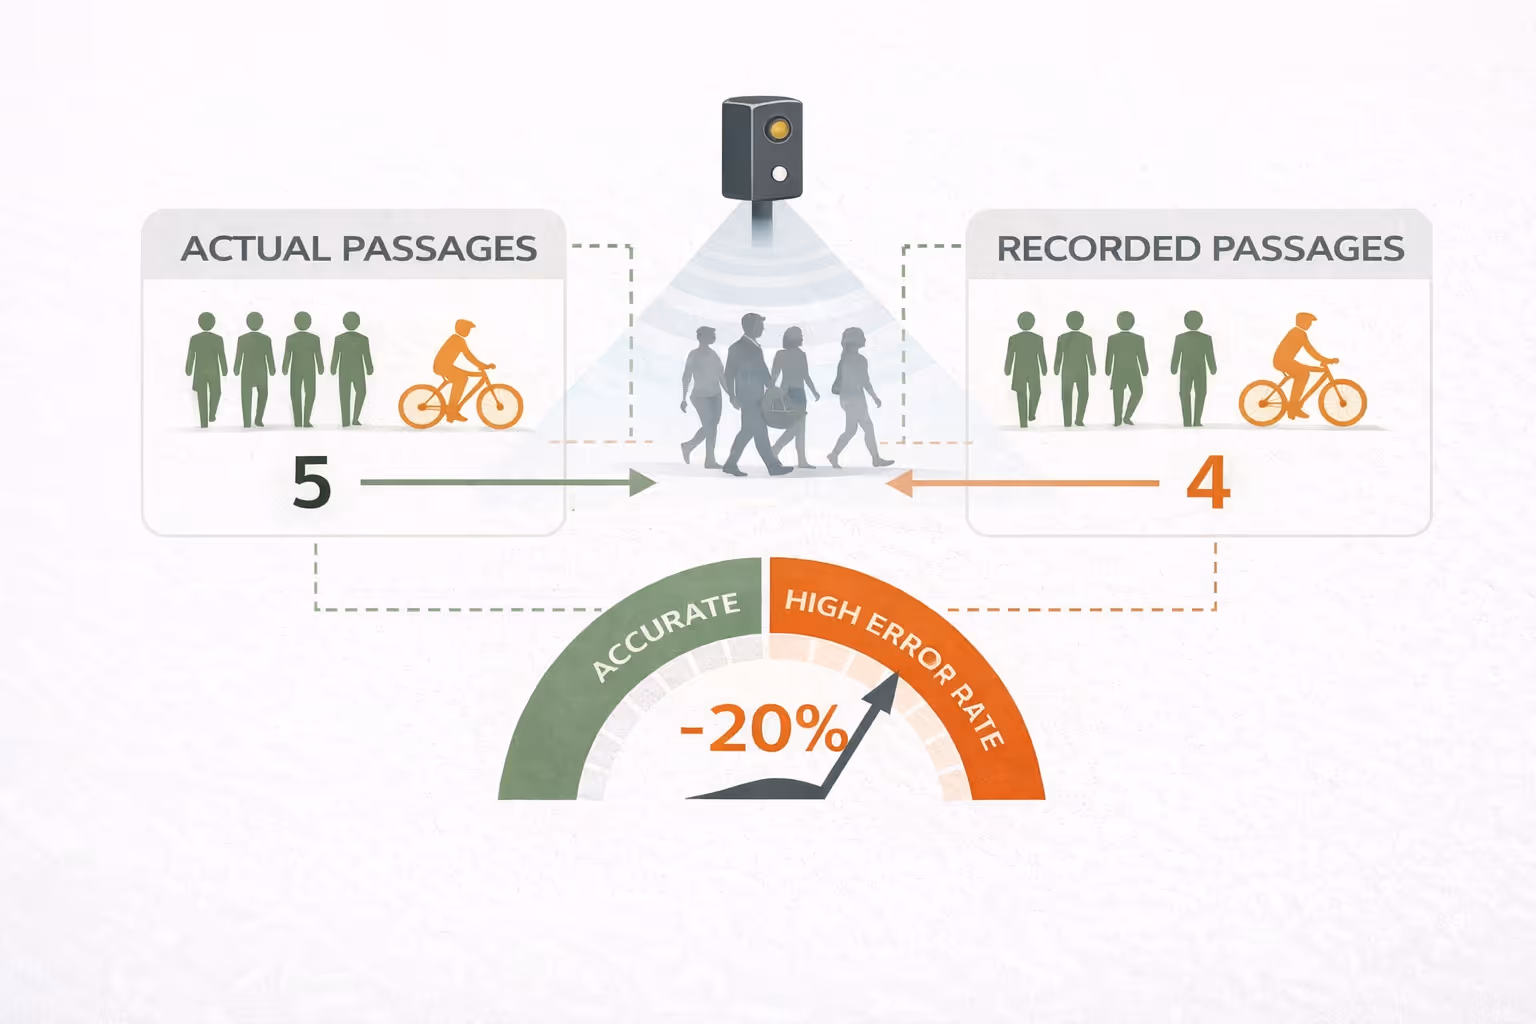
It is the first degradation factor for almost all counting technologies. When two pedestrians pass side by side, or when a group crosses the detection field at the same time, the sensor may have only one individual instead of several. This phenomenon, called occlusion or under-detection, is particularly frequent during peak hours, at the entrance of sports facilities or on bicycle paths combining pedestrians and cyclists.
Stereoscopic thermal sensors partly answer this problem thanks to their double detection angle, which makes it possible to better separate nearby individuals. But no system completely eliminates this bias in a situation of very dense flow. The important thing is to know the threshold at which precision deteriorates, in order to adapt the interpretation of the data accordingly.
For thermal sensors, ambient temperature and the presence of external heat sources can introduce biases. In extreme cold, the temperature difference between the human body and the environment is more pronounced, which can improve detection. Conversely, in high heat, especially on surfaces exposed to direct sunlight, the thermal contrast is reduced and the sensor may miss certain passages or generate false positives.
Parasitic heat sources are another pitfall: parked vehicles, electrical equipment, ventilation ducts. A careful analysis of the site before installation makes it possible to identify these risks and to adapt the positioning of the sensor to minimize them.
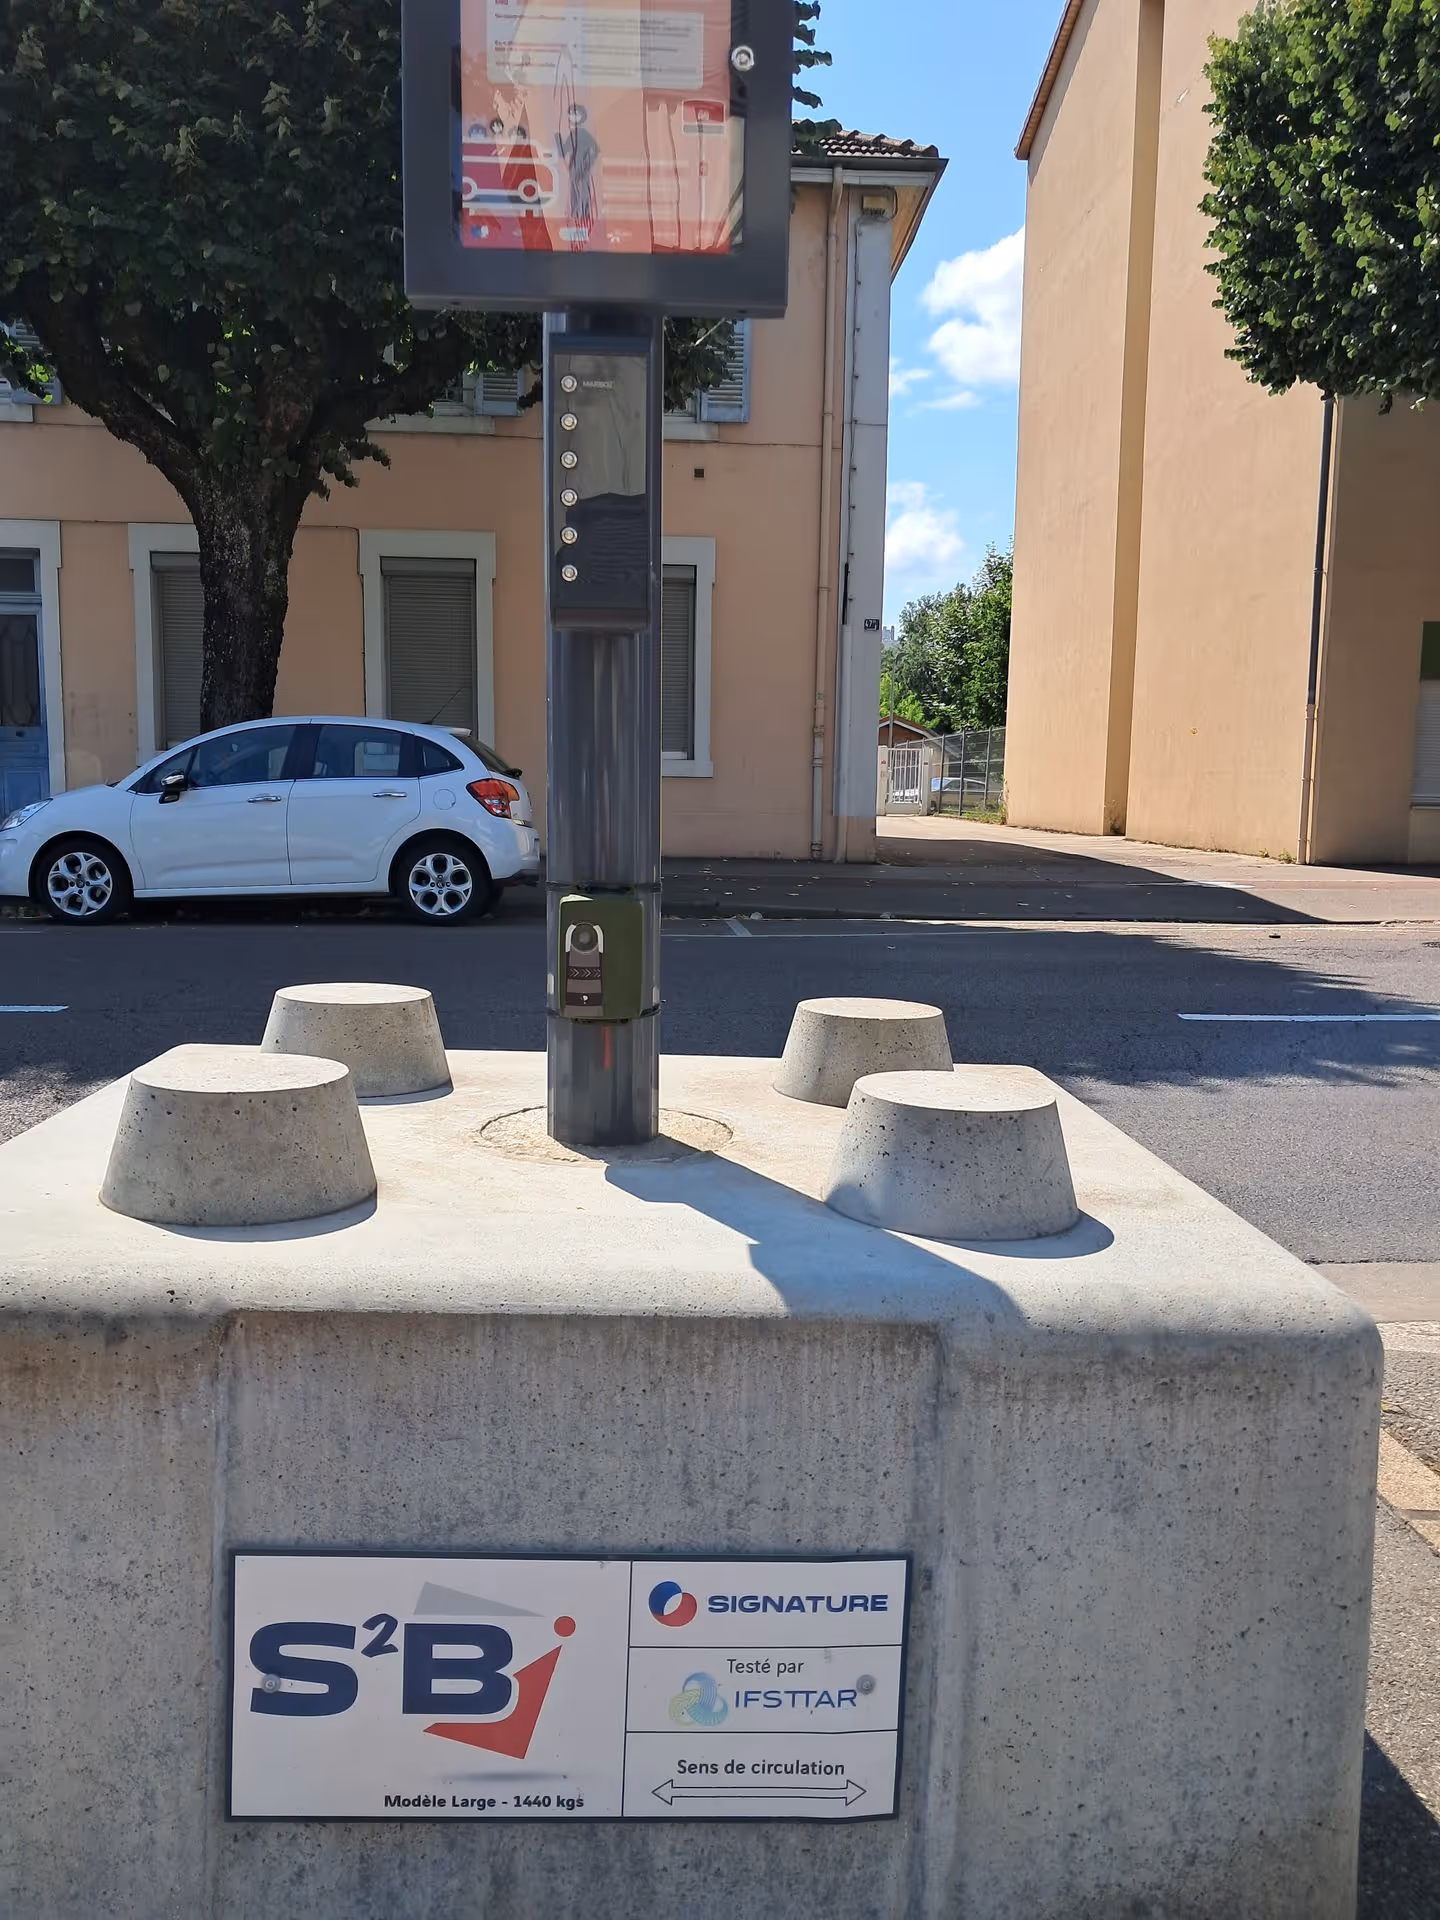
Mounting height is one of the parameters that is most frequently underestimated by non-specialized installers. Each technology has an optimal height range that guarantees an adequate field of detection in relation to the width of the path to be measured. Too low, the sensor may miss border passages or generate occlusions. Too high, the detection field extends beyond the targeted path and can capture parasitic passages.
The angle of installation, in particular the perpendicular position of the sensor in relation to the flow of pedestrians or cyclists, also influences the accuracy. A poorly oriented sensor can systematically undercount users who pass diagonally or who slow down.
A cyclist launched at 25 km/h crosses the detection field of a sensor in a fraction of a second. A toddler, wheelchair user, or group of slow walkers have very different signatures from an adult walking at a normal pace. The least sophisticated sensors, calibrated to a single user profile, can undercount or over-count certain profiles.
The most advanced multi-flow sensors incorporate categorization logic that takes into account speed and thermal signature to distinguish user types, which improves overall accuracy while producing richer data for exploitation.
The answer to this question depends on how you use the data. For a scientific study of flows in dense urban areas, a margin of error of 1 to 2% may be required. For a community that wants to manage the use of a greenway, assess the impact of a development or build a report for a public funder, a margin of error of 3 to 5% is entirely acceptable.
What matters more for territorial uses is the consistency and stability of the margin of error over time. A sensor that systematically undercounts 3% remains usable to analyze trends, compare periods, identify peak traffic or measure the evolution of an axis before and after development. The important thing is that the bias is constant and known, not that it is zero.
The bottom line: It's not absolute precision that counts the most, but the stability of the margin of error over time. A constant and known bias is exploitable; a variable and unpredictable bias compromises the comparability of data.
Conversely, a sensor whose accuracy fluctuates greatly depending on the conditions (from 98% in good weather to 70% in rain) produces data whose comparability is compromised. A report based on this data does not allow us to conclude whether an observed evolution is real or linked to a measurement artifact.
Several approaches make it possible to go beyond the precision figures announced in the technical sheets.
Request validation data in real conditions. A serious manufacturer must be in a position to provide the results of comparative tests carried out on reference sites, with manual or dual-system counts to validate effective precision. These tests must cover various conditions: dense flow, bad weather, night, mixed profiles.
Ask about the methodology for calculating precision. Is the announced rate calculated on simple passages or on real flows? Over what duration and on what type of site? These details allow the figure to be put into context.
Verify the stability of the accuracy over time. A system that progressively degrades without regular recalibration poses a problem of comparability of data over several years. Find out how often you need maintenance to maintain the guaranteed level of accuracy.
Consult feedback from similar users. Communities or managers who have already deployed the solution in contexts similar to yours are the best sources of information on the real behavior of the sensor.
The latest generation stereoscopic thermal sensors, whose design is based on double detection and a flow classification algorithm, achieve accuracy rates of 95 to 98% under normal conditions of use. This performance is achieved regardless of ambient light, which is a significant advantage over systems based on vision or passive infrared sensors.
The residual margin of error is mainly due to very dense flows and strictly simultaneous passages. It is homogeneous over time and known, which makes it possible to integrate it into data analysis methods. For local authorities and territorial managers, this stability is the guarantee that comparisons from one year to the next, or before and after a development, reflect real changes in attendance and not variations in sensor performance.
It is precisely this reliability over time that makes counting data a credible tool for justifying public investments, constructing grant applications or evaluating mobility policies.
Evaluating a speedometer based solely on its theoretical accuracy rate is the same as choosing a car based solely on its maximum speed. What matters in a real situation is the performance under normal conditions of use, the consistency of the data over time and the ability of the system to produce usable information for decision-making.
For communities, tourist offices, park managers or event organizers, A sensor with 96% stable accuracy is better than a system with 99% stability in the laboratory but whose performance deteriorates in the rain, in dense flows or after a few months of operation without maintenance.
Before any purchase, requiring validation data in real conditions, questioning the stability of precision over time and comparing the figures with the feedback of similar users remains the most solid approach to make an informed choice.


.svg)


.avif)