Twenty years ago, creating a bike path was an end in itself. The existence of the infrastructure was sufficient to justify the investment. Today, the context has changed.
Communities must be accountable for the use of public money. Citizens, through participatory budgets and consultations, are asking for evidence of effectiveness. Opponents of certain projects — motorists unhappy with the reduction of lanes, residents worried about noise — demand that the development demonstrate its usefulness.
Result: A cycling development that does not produce a measurable impact becomes a political target. Conversely, a development whose impact is documented becomes an argument for subsequent projects.
Public funding programmes — AVELO, CRTE, European funds, calls for regional projects — increasingly require impact assessments to assess renewal or extension applications. Funders want to ensure that supported projects produce the expected effects.
Concrete example: A community that has received a grant to create 5 km of bike path and can demonstrate a 40% increase in bike use on the developed road will have a much easier time obtaining a grant for the next 10 km.
Measuring impact also allows you to learn. Not all arrangements produce the same results. Some types of configurations (bi-directional paths, bike lanes, greenways) work better than others depending on the context. Some neighborhoods are adopting bikes quickly, others more slowly.
Without systematic impact assessment, communities repeat the same mistakes and miss opportunities for improvement. With evaluation, they accumulate a detailed knowledge of what works and can optimize future projects.
The reference method for evaluating the impact of a development is the approach Before/after : measure the situation before development, measure the situation after, and compare.
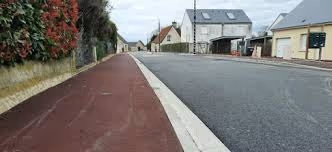
A measuring device is installed on the axis concerned several months before the start of work. Bicycle use is recorded in the initial configuration (shared lane, unprotected strip, total absence of infrastructure). After the installation has been put into operation, the measurement is continued for several months. The difference between the two periods gives the impact.
Simple formula: Impact = Attendance after - Attendance before
If the number of cyclists increases from 150 cyclists/day before to 250 cyclists/day after, the impact is +100 cyclists/day, or +67%.
The before-and-after approach eliminates much of the interpretation bias. We do not compare the arranged axis with another axis (which would have different characteristics), we compare the axis with itself in two successive configurations. The context variables (location, service, socio-economic profile of local residents) remain the same.
For the before-and-after comparison to be reliable, several conditions must be met.
Sufficient measurement time before. It is necessary to measure at least 3 months before the start of work, ideally 6 months to capture seasonal variations. A measurement over a single week before work does not make it possible to distinguish the development effect from normal fluctuations in attendance.
Sufficient measurement time afterwards. It is necessary to measure at least 6 months after commissioning, ideally 12 months. The impact of a development takes time to stabilize: users are gradually discovering the infrastructure, travel habits are slowly changing, and word-of-mouth is spreading.
Comparability of periods. You have to compare equivalent periods: if you measure April-September before work, you have to compare with April-September after work (the following year or two years later depending on the duration of the work). Comparing the summer before with the winter after completely falsifies the analysis.
Stability of the other variables. Between the “before” and the “after”, no other major change should occur on or near the axis: no new company that generates flows, no closure of a competing axis, no massive communication campaign on the bike. If such a change occurs, it must be taken into account in the interpretation.
Measuring the impact of bicycle development is not just about counting cyclists. Several dimensions must be evaluated to have a complete vision.
This is the most direct indicator: how many cyclists use the developed road? The increase in volume is the most obvious sign of success.
Expected order of magnitude: On a structuring urban axis, a well-designed bike path can generate an increase in ridership of 30 to 100% in one year. In Paris, the evaluation of two-way cycling showed an increase in ridership of up to 100% in certain lanes after development (CEREMA, 2012). On a peri-urban or rural axis, the increase may be more modest (15 to 40%) because the initial density is lower.
Limit: An increase in volume says nothing about the origin of these new cyclists. Is it a question of modal shift (motorists who became cyclists) or spatial transfer (cyclists who used another axis and who moved to the new layout)?
The aim of cycling policies is not only to increase the number of cyclists, but to reduce car dependence. It is therefore necessary to measure whether the development has produced a modal shift.
How to measure it: Before/after surveys among users of the axis: “Before this development, how did you do this route? ” The answers make it possible to estimate the proportion of new cyclists who come from the car, public transport, walking, or who are new travelers.
Order of magnitude: Based on successful arrangements, 40 to 60% of new cyclists say they have abandoned the car for all or part of their trips on this axis.
Limit: Declarative surveys include biases (social desirability, inaccurate memory). They must be sized on sufficient samples (at least 100-200 respondents) to produce reliable results.
Successful cycling arrangements should improve the safety of cyclists. Comparing the number of accidents before and after is an important impact indicator, even if difficult to interpret over short periods of time (cycling accidents are thankfully rare).
How to measure it: Analysis of police/gendarmerie accident data on the axis concerned, by comparing the 2-3 years before with the 2-3 years after. Attention: the number of accidents must be related to the volume of cyclists (accident rate per 100,000 trips) rather than to the gross number of accidents.
Expected result: Protected bike paths significantly reduce the accident rate. In New York, the 9th Avenue protected trail led to a 56% reduction in injuries for all users, including 57% for cyclists (NYC DOT, 2013). In the Netherlands, the systematic approach of separating cycling and motorized flows has contributed to an 80% reduction in cycling deaths over 30 years (Safety of Cycling Infrastructure study, 2015).
Limit: Serious accidents are rare. On a modestly sized axis, there may be no accidents for several years, making the indicator statistically insignificant.
The impact of a development is also measured by the lived experience of users: do they feel more secure? Is the infrastructure comfortable? Would they recommend the axis to a beginner cyclist?
How to measure it: Before/after satisfaction surveys, or annual bicycle barometer (FUB), which measures the feeling of cyclists at the scale of a city.
Expected result: Quality amenities increase the feeling of safety by 30 to 50 points (on a scale of 0 to 100). This increase is often more marked than the increase in attendance, because the facilities reassure occasional cyclists and potential non-cyclists.
Limit: A sense of security does not always reflect objective safety. A layout can be subjectively perceived as safe while presenting dangerous points of conflict (poorly treated intersections).
Successful cycling schemes attract user profiles who did not dare to travel before: women, children, the elderly, and occasional cyclists. The diversification of profiles is a sign that the infrastructure has lowered barriers to entry.
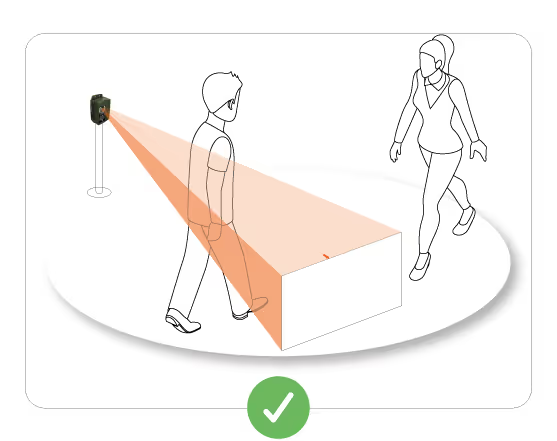
How to measure it: Field observations before/after (manual counts with distinction of profiles: estimated age, gender, type of bike), or surveys.
Expected result: In terms of structural arrangements, the share of women in bicycle traffic is increasing significantly. This increase can also be observed at the national level: in the FUB Bicycle Cities Barometer, the share of women among respondents increased from 46% in 2021 to 51.1% in 2025, a sign of a feminization of the practice correlated to the improvement of protected infrastructures. It is a robust indicator of the quality of infrastructure: women massively adopt cycling when the facilities guarantee a high sense of security.
Even with a rigorous before-and-after methodology, several pitfalls lie in wait for the interpretation of results.
An increase in bicycle traffic after the creation of a development does not automatically prove that the layout is the cause. Other factors may explain the increase.
Examples of confounding factors:
How to avoid this bias: Document all the contextual changes that occurred between the before and the after. If possible, compare the evolution of the developed axis with that of undeveloped control axes (to isolate the specific effect of the development).
Uses take time to stabilize after development. Measuring one month after the opening produces a misleading image: some users have not yet discovered the infrastructure, others test out of curiosity and then give up.
Good practice: Wait at least 6 months after the end of the work before producing a report. The impact is measured over time, not hot.
An isolated bicycle layout produces less impact than one that is integrated into a coherent network. If the new bike path connects two neighborhoods without continuity before or after, its impact will be limited. If it complements an existing network by filling in a missing link, its impact can be multiplied.
Involvement: The assessment should take into account the network context. An axis that “unlocks” continuity will have an impact greater than its length alone would suggest.
An increase in attendance on developed routes may be accompanied by a decrease in traffic on competing routes. If 100 new cyclists appear on the new track, but 60 of them previously took a parallel street, the net impact is +40 cyclists, not +100.
Good practice: If possible, simultaneously measure the use of competing routes to identify spatial delays.
Proving the impact of bicycle development is not a communication exercise. It is a strategic management tool. Communities that systematically assess their developments build up a thorough understanding of what works and what fails. They can adjust their future choices, optimize budget allocation and defend their projects with factual arguments.
The before-and-after method, although simple in principle, requires rigor: sufficiently long measurement before and after, comparability of periods, consideration of confounding factors, diversity of indicators (not only volume). Misinterpretations are common — confusing correlation and causality, measuring too early, ignoring the network effect — but they are avoidable if the methodology is rigorous.
The three cases presented illustrate an important reality: Not all developments have the same impact. Continuously protected tracks generate spectacular increases in attendance (+100 to +150%) and a significant modal shift. Greenways create new uses rather than deferrals. Unprotected bike lanes produce modest impacts.
This diversity of impacts does not mean that some adjustments are useless. It means that the objectives must be adapted to the type of infrastructure, and that the assessment must take into account these differences. A recreational greenway that generates +200 passes/day of walkers on weekends is a success, even if it does not reduce car traffic. An urban bike path that only attracts +20 cyclists/day after one year is a failure, even if it cost less.
Assessing the impact is not an administrative constraint. It is a learning opportunity that makes it possible to build increasingly effective cycling policies, based on evidence rather than intuition.
The figures and orders of magnitude quoted in this article are based on the following sources:
CEREMA (Center for Studies and Expertise on Risks, Environment, Mobility and Development)
Barometer of cycling cities (FUB — French Federation of Bicycle Users)
International studies on the safety of bicycle facilities
These references constitute robust orders of magnitude for the evaluation of cycling facilities. Each territory must adapt these indicators to its local context and conduct its own before-and-after evaluations to produce specific data.


.svg)