

English
The question seems simple. A natural park, a public square, a greenway, a museum, a train station: how many people frequent these places? But behind this apparent simplicity lies a methodological complexity that managers of public spaces often underestimate. Measuring attendance is not just about counting visits. First, you need to define what you are measuring, choose a method adapted to the context, understand the limits of this method, and interpret the numbers carefully. This article explores the different measurement approaches, their strengths and weaknesses, and proposes a framework for thinking of attendance measurement as a management tool rather than as a quest for an absolute number.

Before choosing a measurement method, you need to clarify what you want to know. “Measuring attendance” can mean very different things depending on the context and the objective.
The same visitor who enters a park, walks there for two hours and then leaves generates two passages (one at the entrance, one at the exit). Are these two visits or just one? The answer depends on what you want to fly.
To size a car park or a ticket office, what counts is the number of unique visitors present at a given moment. To assess the wear and tear of a trail or the load on a bridge, what counts is the total number of crossings, whether done by the same people or not.
Concrete example: A loop greenway sees 200 cyclists pass during the day. But 150 of them go all the way around and therefore pass back in front of the measurement point. The sensor records 350 passages. Should we communicate 200 cyclists (unique visitors) or 350 passages (total flow)? Both numbers are true, but they don't tell the same story.
Some spaces are places of destination (people come to stay there), others are places of transit (we cross them to go elsewhere). This distinction radically changes the way attendance figures are interpreted.
An urban park can accommodate 1,000 people per day who stay there for an average of 45 minutes (place of destination), or 1,000 people who cross it in 3 minutes to reach a metro station (place of transit). The raw number is the same, but the use is incomparable.
Measuring attendance without distinguishing between these two profiles leads to misinterpretations. A very busy area in rapid transit requires different arrangements (path width, fluidity) from an area frequented in a long presence (benches, shaded areas, sanitary facilities).
On a linear path, measuring the inflow is enough: each person who enters will leave from the same point or from a known end. On a networked space (park with several entrances, city center), measuring a single point only gives a partial vision.
If a park has five entrances and you only measure the main entrance, you may be capturing 60% of the total flow, but you don't know the 40% that enters through the side entrances. Decisions made on the basis of this partial measure will be biased.
So the first question to ask is not “how to measure?” but “what do I want to know, and why?” ” The method comes from the answer.
There are three main families of methods for measuring the use of a public space. Each has its advantages, limitations and areas of relevance.
Declarative measurement is based on what users or agents say. Gym attendance sheets, attendance surveys with a sample of visitors, logbooks filled out by reception agents.
Advantages:
Structural limitations:
When to use it: To supplement quantitative data with qualitative elements, or in the exploratory phase when no objective measurement system is yet in place.
Manual observation consists in posting one or more agents at strategic points to count passages during a given period (one day, one week). This method is still widely used for attendance surveys commissioned from design offices.
Advantages:
Structural limitations:
When to use it: For specific studies, automatic device validations, or when the precision of observation justifies the cost (behavioral studies, diagnoses of conflicts of use).
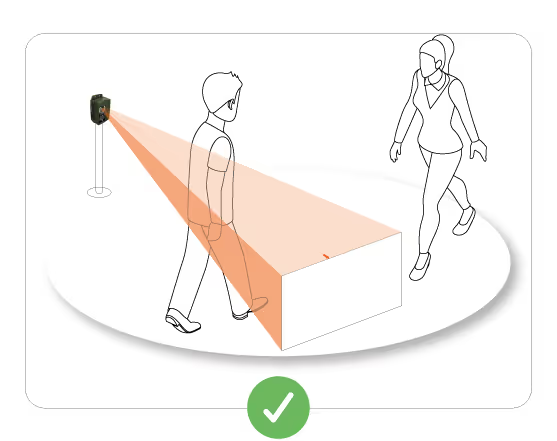
Automatic capture is based on technological devices that record passages continuously, without human intervention: thermal sensors, radars, inductive loops, mobile data flow analyses (with RGPD precautions).
Advantages:
Structural limitations:
When to use it: For long-term management, impact assessment before and after development, documentation of financing applications, or when the continuity of the measure is a requirement.
Whichever method you choose, attendance figures tell only part of the story. They quantify a phenomenon, but they don't explain it. Three essential dimensions are beyond pure quantitative measurement.
A space can be very busy and generate a degraded experience (saturation, conflicts, noise, perceived insecurity). Conversely, a moderately frequented space can offer a high quality experience (calm, contemplation, comfort).
Attendance figures do not distinguish between these two situations. Is a park that increases from 500 to 800 visitors per day experiencing a positive dynamic (the space is becoming more and more popular) or a deterioration (the space is becoming too busy)? The answer is not found in raw figures, but in qualitative observation and user feedback.
Involvement: The attendance measurement must always be supplemented by satisfaction surveys, field observations or exchanges with regular users. The two perspectives — quantitative and qualitative — are complementary, not substitutable.
Why are people coming? To relax, to play sports, to move quickly, to meet other people, by obligation (mandatory passage to another place)? These motivations determine expectations and needs.
The same attendance figure (300 visits per day) can correspond to radically different uses:
Each of these profiles involves different arrangements. The measurement of attendance does not make it possible to decide between these scenarios. It must be enriched by observations or targeted surveys.
Two user populations can coexist peacefully at low densities, then come into tension when attendance increases. Fast cyclists vs slow walkers, dogs roaming free vs families with young children, noisy groups vs people looking for peace and quiet.
Global attendance figures mask these dynamics. A greenway that registers 400 trips per day without distinction can in fact experience peaks of conflict at certain hours (18h—19h, superposition of commuter cyclists and evening joggers) while being underused the rest of the day.
Involvement: Measuring total attendance is not enough. It is also necessary to analyze the temporal distribution, distinguish user profiles (pedestrians/cyclists) and cross this data with feedback from agents or users.
Measuring attendance is not an end in itself. It is a tool at the service of one objective: to understand uses to better manage public spaces. This goal cannot be achieved through the accumulation of numbers alone.
The effective model combines three dimensions:
Example of an integrated approach:
A community installs sensors on a greenway. The data shows an increase in attendance of 25% in one year. Is that good news?
The conclusion changes dramatically. The action to be taken is not to passively celebrate, but to manage the cohabitation of uses: widening the road, marking on the ground, raising awareness, or even separating flows according to configurations.
Even when measured well, attendance can be misinterpreted. Here are the most common pitfalls.
Measuring for a week in July and extrapolating to the entire year on a tourist site leads to overestimating annual attendance by 200 to 300%. Seasonal, meteorological and event variations are too strong for a few days to be representative.
Good practice: Measure for at least three months including contrasting periods, or measure continuously for one year to capture all variations.
Comparing the visits to two sites measured with different methods, at different periods of time, over different periods of time does not produce reliable information. A site counted in summer with manual observation vs a site counted in winter with automatic sensor: the figures are not comparable.
Good practice: Standardize measurement methods, periods and durations if the objective is to compare several sites.
The use of a greenway increases by 30% after development work. Can we conclude that construction is the cause of this increase? Not necessarily. Perhaps a new employer has settled nearby, a communication campaign has been launched, or the weather was exceptionally favorable that year.
Good practice: Analyze contextual factors (employment, communication, weather, events) before attributing a variation in attendance to a single factor.
Every measurement has a margin of error. A sensor can miss 5% of passages (occlusions, passages at the edge of the field). A manual count may miss 15%. Presenting the numbers without mentioning this uncertainty creates a false impression of absolute accuracy.
Good practice: Document the measurement methodology, indicate the estimated margins of error, and present the figures with an appropriate level of granularity (round to ten or a hundred depending on the accuracy).
Can we really measure the number of visitors to a public place? The answer is yes, as long as you clarify what you are measuring, choose a method adapted to the context and the objective, and interpret the numbers carefully.
But the real question is not “can we measure?” ”. It's “why are we measuring? ”. If the goal is to get a number to put into a report, measuring is a formal exercise with no value. If the objective is to understand uses to better manage space, adapt layouts, anticipate tensions and justify investments, then measurement becomes a strategic lever.
Attendance is not a number. It is a complex, multidimensional phenomenon that varies in time and space. Measuring it requires methodological rigor. Interpreting it requires caution and perspective. Exploiting it requires combining quantity and quality.
Territories that understand this complexity — and that invest in robust measurement devices while maintaining a critical look at the figures produced — are giving themselves the means to manage their public spaces lucidly. The others navigate by sight, at the risk of making costly mistakes.


.svg)