

English
In a logic of experimentation and evaluation of uses, the Communauté d'Agglomération du Niortais has deployed a Kiomda meter to monitor the attendance of a parking relay. The objective: to better understand user behaviors (schedules, drawdown logic) and to test flexible counting solutions. Beyond measurement, the challenge concerns the ability to quickly use readable data to meet the expectations of elected officials and manage mobility policies.

The community is part of an approach ofexperimentation with counting solutions, in particular to support the development of mobility and associated infrastructures (parking and relay, bicycle facilities).
The meter was installed on a Parking relay, with a specific objective:
Understand the arrival times and qualify uses (in particular use as a connection to other modes of transport).
This project is also part of a broader logic of comparison between different counting devices, the community being required to test several market solutions.
“The idea was to test flexible and flexible counting systems, and to compare the uses between different suppliers.”
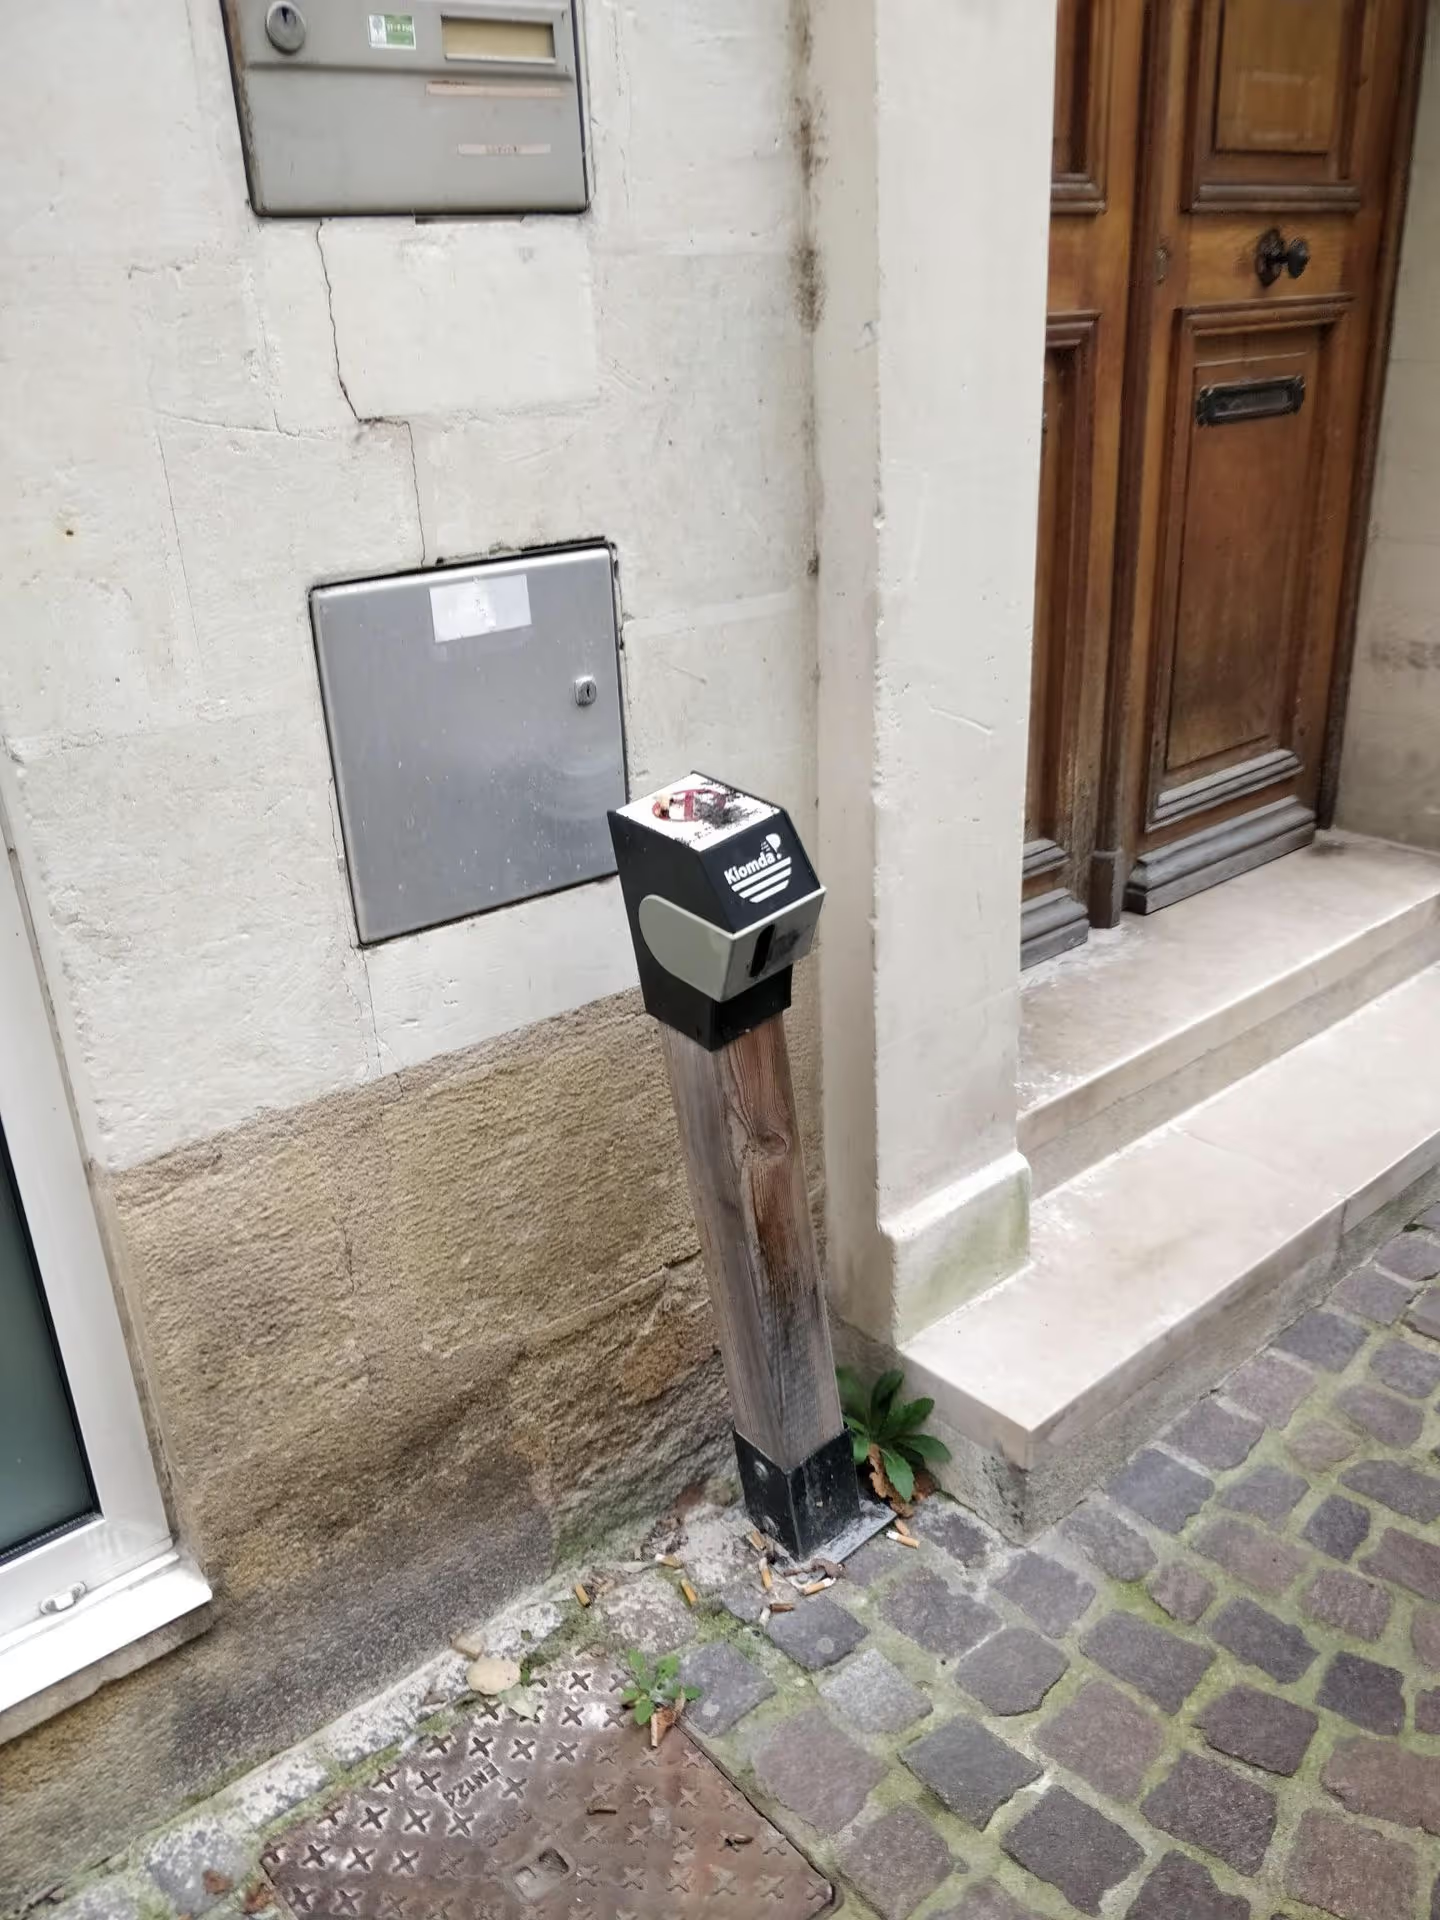
Kiomda provided the supply and maintenance of a vehicle counting unit, installed in a relay car park since January 2025.
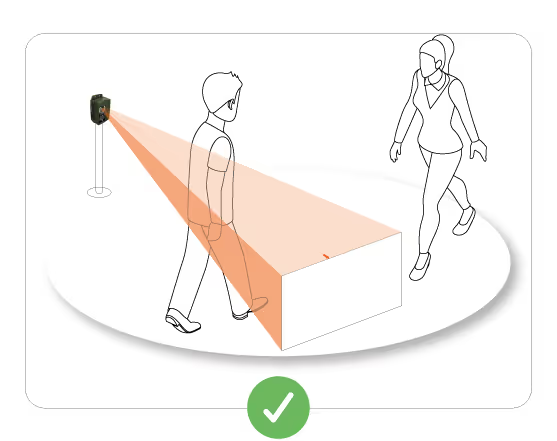
The device includes:
The tool is part of an exploratory approach, with use that is still occasional at this stage.
The data collected aims to provide a first level of understanding of uses, in particular:
“I look at the number of people using the car park, especially the arrival times, to see if it is used as a relay car park.”
However, the community emphasizes that the analysis still needs to be completed by qualitative data, in order to better understand user behavior.
A central issue concerns the readability and usability of data, in a context where teams have little time to analyze them.
“We have more and more mobility data and few human resources to process them. You need to be able to quickly access simple and usable data.”
Expectations are clearly expressed:
“The idea is not to have dozens of ratios, but 5 or 6 indicators that are easy to read and use.”
The Kiomda solution is considered relevant in several aspects:
“When talking to Kiomda, I never had any problems. They have always been of high quality.”
However, areas for improvement are identified, mainly around the interface:
1. Exploitation of data
“The tool is still limited compared to what one might expect today in terms of monitoring.”
2. Data reliability and validation
The community is also positioned as field of experimentation, open to testing changes to the platform.


.svg)


.avif)