

English
Creating a greenway or a bike path represents a significant investment for a community: preliminary studies, land acquisition or easements, development work, signage, maintenance. Once the infrastructure is put into service, the question inevitably arises: does this development produce the expected effects? Is it actually being used? Does it justify the investment made? These are not just political or budgetary issues. They condition the ability of the community to obtain new funding, to legitimize its choices with citizens and to manage its active mobility strategy over the long term. Measuring the impact of a greenway or a bike path is therefore not an option: it is a requirement of good public management. This article explains which indicators to follow, how to structure measurement before and after development, and how to use this data to capitalize on successes and correct shortcomings.

A greenway or a bike path is not an end in itself. It is a means at the service of territorial objectives: encouraging active mobility, reducing the use of cars, improving air quality, developing soft tourism, connecting employment areas, offering accessible leisure spaces. To know if these objectives are being achieved, it is necessary to measure the real use of the infrastructure.
Without measurement, it is impossible to answer the following questions: how many people use this greenway every day? Is this attendance in line with the initial projections? Did the development generate a significant modal shift (users who abandoned the car in favor of cycling)? What are the peak periods and the off-peak periods?
These questions are not trivial. They condition the ability of the community to:
An underused greenway can reveal a problem with route continuity, poor signage, insufficient perceived safety, or limited accessibility. Without attendance data, these problems remain invisible or subject to subjective debate. With objective data, they can be identified and corrected in a targeted manner.
Conversely, a busy greenway justifies additional investments: bicycle parking, water points, rest areas, network extensions. Attendance data makes it possible to prioritize these investments based on real use rather than intuition or political pressure.
Impact measurement is based on a simple principle: compare the situation before development with the situation after development, ensuring that the comparison is methodologically sound.
These indicators should be measured before and after development. The “before” measurement can be carried out on an undeveloped section, on a temporary itinerary or on a comparable axis if the greenway is a creation ex nihilo. The “after” measurement must be carried out as soon as the lane is opened and maintained for at least 6 to 12 months to neutralize the effects of novelty and capture seasonal variations.
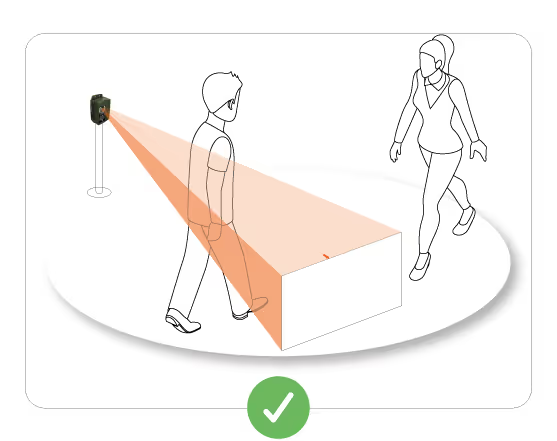
The placement of sensors determines the quality and representativeness of the data. Several principles should guide this choice:
Place the sensors on representative sections of the infrastructure. If the greenway crosses dense urban areas, peri-urban areas and rural areas, it is relevant to measure attendance on each of these sections to identify variations in use. A single sensor placed in the city center will give a biased view of overall attendance.
Avoid atypical areas. A sensor placed just after a picnic area or a car park will capture redundant passages (immediate return trips) that do not reflect the real use of the lane. Likewise, avoid areas where one-off events (markets, events) can distort data.
Give priority to mandatory crossing points. If the greenway has several entrances and exits, placing sensors at mandatory crossing points (bridges, tunnels, major intersections) makes it possible to measure overall attendance rather than partial flows.
Precisely document the location. Each sensor must be georeferenced (GPS coordinates) and its position must be clearly described in the reports. This documentation allows data to be compared over time even if the sensors are moved or replaced.
For a measurement before development: a minimum duration of 3 months is recommended. Ideally, 6 to 12 months allow seasonal variations to be captured and the biases associated with one-off events to be eliminated.
For a measurement after layout: It is essential to keep the count for at least 6 months after opening. The first few months can be marked by a novelty effect (curiosity, media coverage) that generates artificial attendance. After 3 to 6 months, use stabilizes and better reflects structural attendance.
Some arrangements require measurements over several years to identify trends. A newly opened greenway can experience gradual growth in ridership over the years as users discover it, secondary routes connect, and mobility patterns change. A measurement at 1 year, then at 3 years and at 5 years makes it possible to document this trajectory.
Communities that install permanent sensors benefit from a continuous vision without having to organize ad hoc measurement campaigns. This approach is particularly suited to networks of greenways or structuring cycle paths.
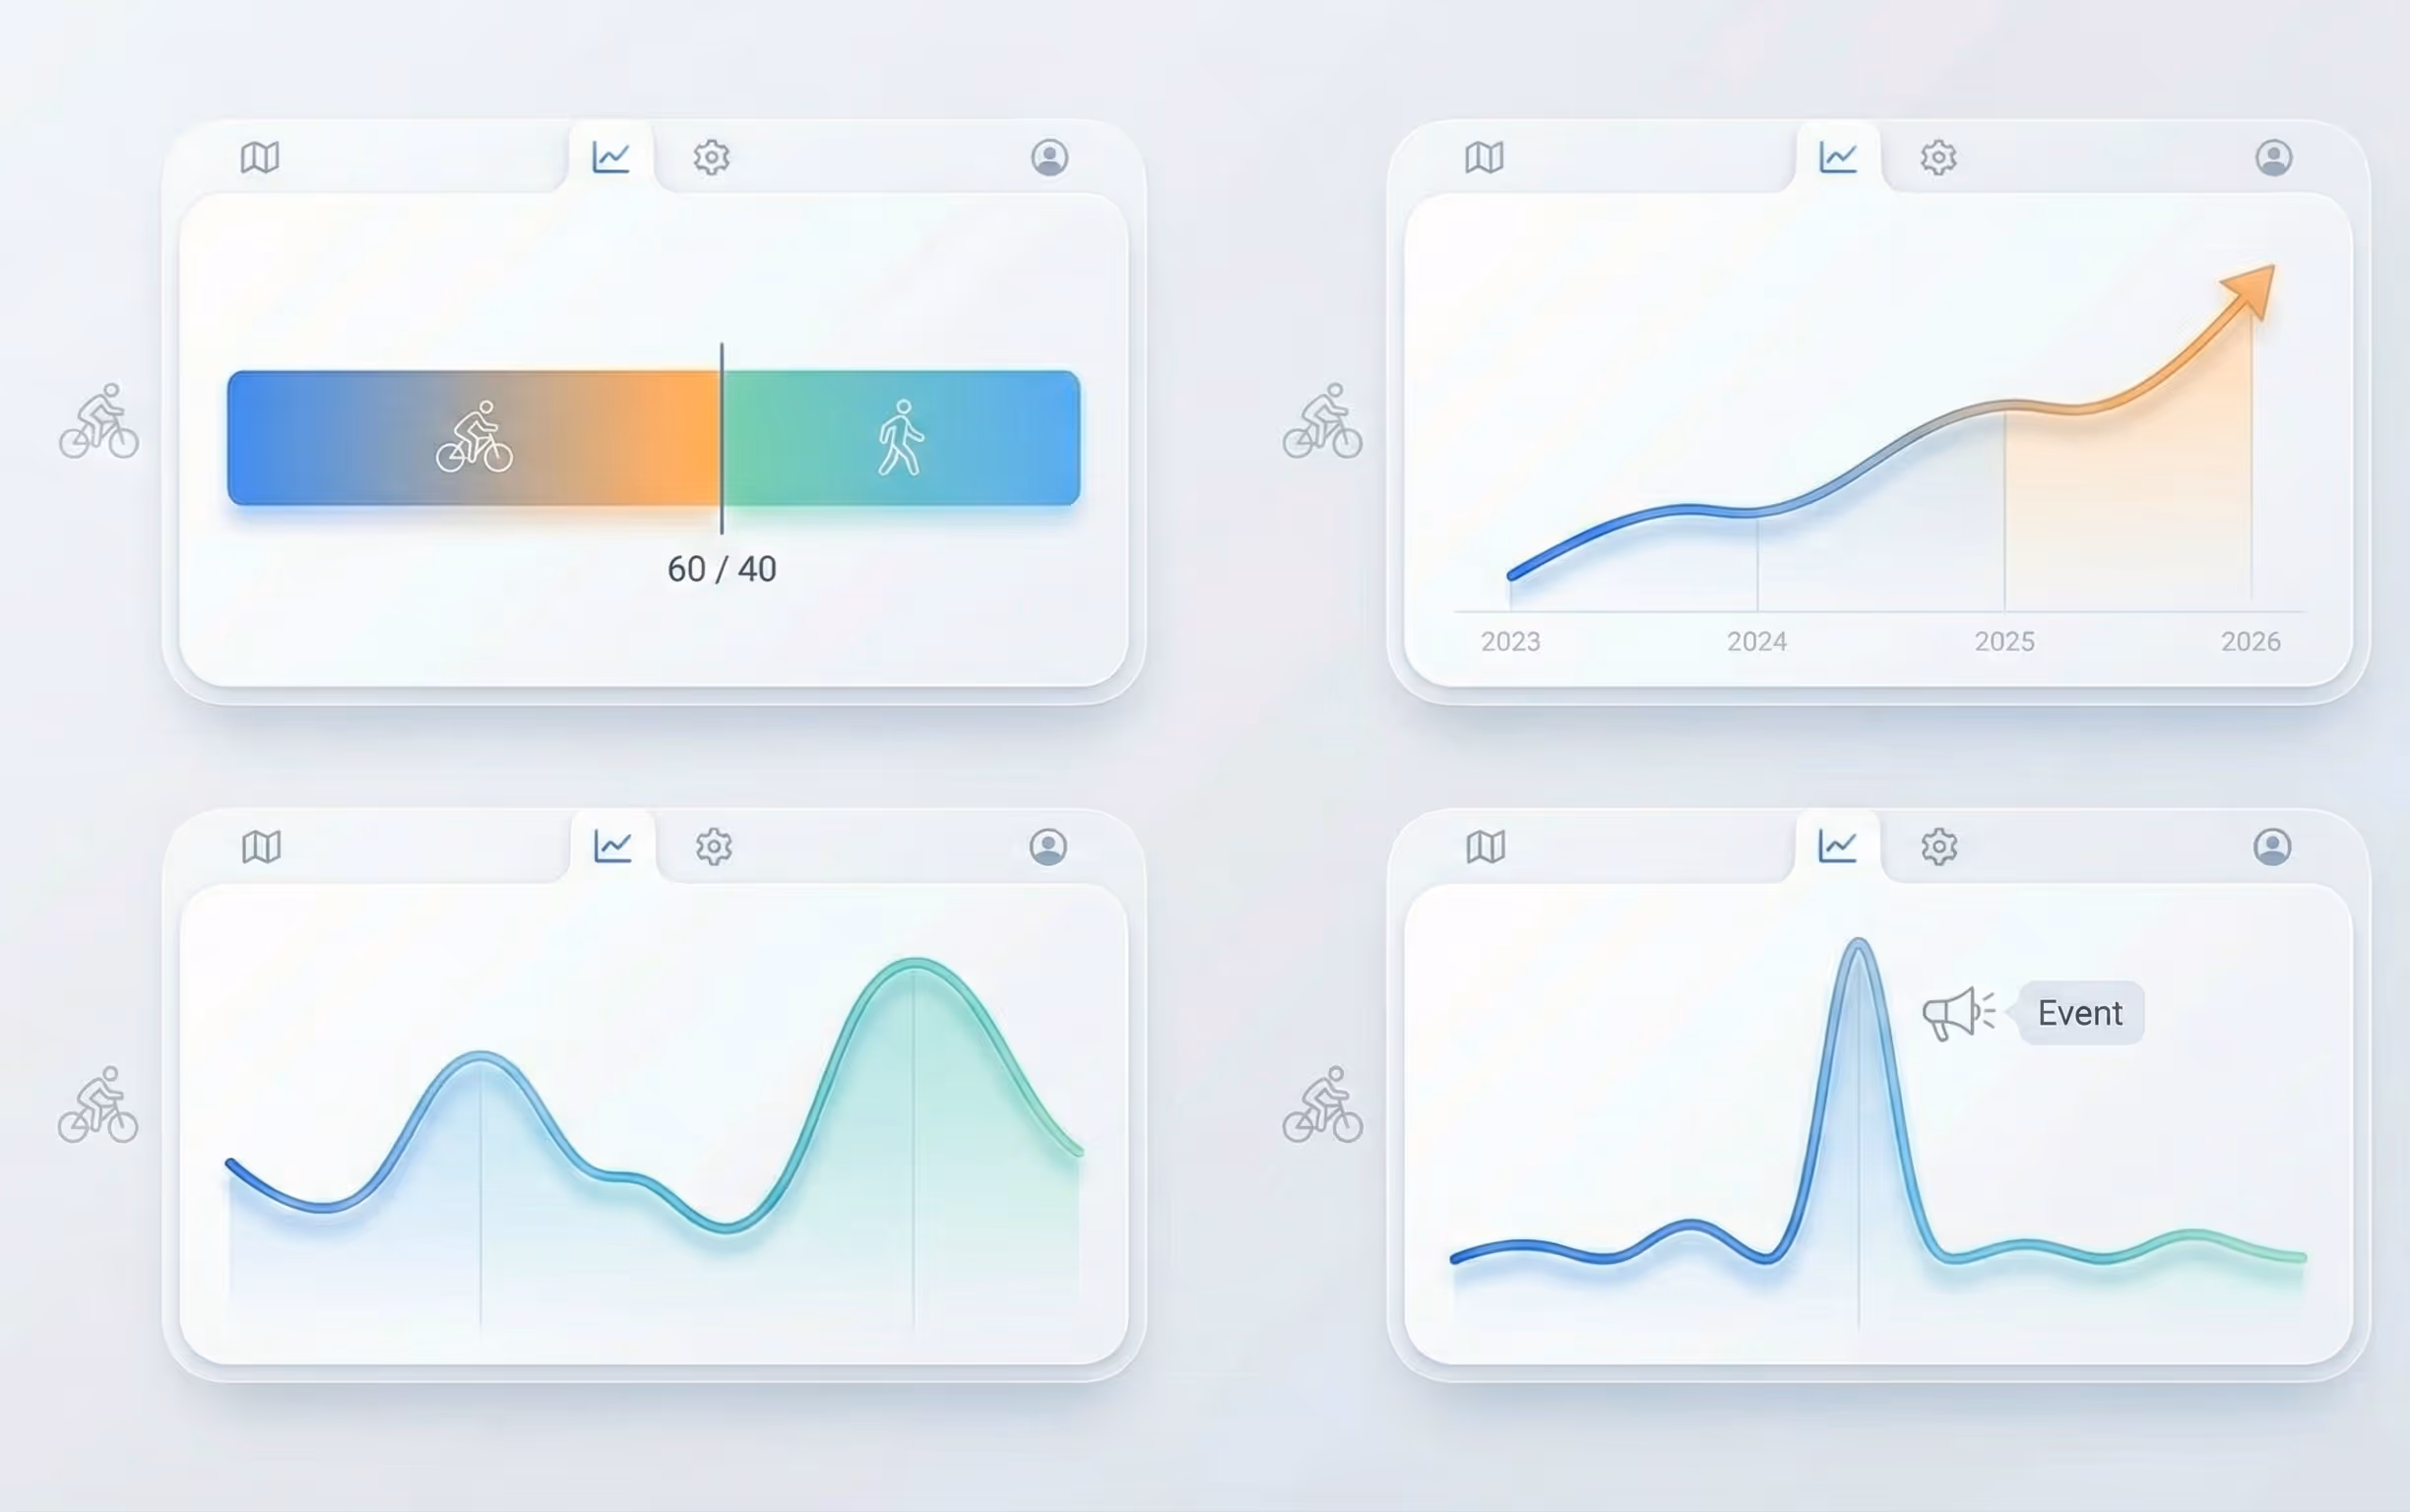
Seasonality analysis is often overlooked in impact assessments, despite the fact that it provides strategic information for infrastructure management.
Greenway with high summer seasonality (attendance multiplied by 3 or 4 between winter and summer) → Mainly tourist and leisure use. This involves adapting maintenance (reinforcement in high season), communication (promotion at tourist offices) and services (opening of water points, public toilets, temporary bicycle parking).
Greenway with stable attendance all year round, with daily peaks during morning and evening rush hours → Mostly utility use (trips between home and work). This justifies investments in security (lighting, winter snow removal), in connections with employment areas and in communication with employers and employees.
Mixed use greenway (high tourist numbers in summer, utility use the rest of the year) → Requires a development and service strategy differentiated according to the periods.
Seasonality data also makes it possible to identify critical periods for maintenance. Although 60% of annual traffic is concentrated between May and September, it is essential that the track be in excellent condition during this period. Major interventions (resurfacing, major prunings) can be planned during off-peak periods to limit discomfort to users.
Finally, seasonality is an indicator of changes in use over time. If a greenway that was very seasonal at the beginning sees its winter attendance gradually increase, this means that it is in the process of becoming a utility axis in addition to its tourist vocation. This evolution must be anticipated in complementary investments.
Data on the use of a greenway or a bicycle path is not only used to evaluate the project that has just been completed. They constitute a reusable knowledge capital for future projects and for funding applications.
A community that has shown that a first greenway generated an average of 300 crossings per day, with a growth of 15% per year, has a internal benchmark to calibrate his next projects. If it plans to create a second greenway in a comparable context, it can project similar attendance with a high level of confidence.
This data also reinforces the credibility of grant applications. Funders prefer territories that can demonstrate that their previous investments have produced the expected results. A case based on quantified impact assessments from previous projects is much more likely to be financed than a case based solely on hypotheses.
Attendance data can also be used in the territorial communication. Publishing an annual report with traffic figures on greenways and cycle paths, accompanied by an analysis of trends, contributes to the transparency of public action and reinforces the image of a region committed to active mobility.
Some communities are setting up active mobility observatories that centralize attendance data for their entire network. These observatories make it possible to compare the performances of the various axes, to identify growth drivers and to manage the mobility strategy in an integrated manner.
To facilitate the exploitation of attendance data, it is useful to structure the results in the form of a summary dashboard. Here is an example of a typical structure:
This dashboard can be produced at regular intervals (every 6 months, every year) and sent to elected officials, funders and technical services. It constitutes a strategic management tool and a communication medium on the effectiveness of active mobility policies.
Communities that adopt this systematic monitoring approach are gradually building a data culture that benefits all of their development projects. They move away from intuitive logic to an evidence-based logic, which improves the quality of decisions and reinforces the legitimacy of public action.
If you have set up a greenway or a bike path and want to set up an impact measurement system, Kiomda can assist you in defining indicators, installing sensors and exploiting data to produce usable reports.


.svg)