Count pedestrians simply and without installation

For every site with pedestrian traffic — park, public building, event, or trail. A sensor, a counting point, actionable data.

Mon site peut-il être mesuré ?

Dans la plupart des cas, oui — un point de passage naturel suffit.

Quelles données vais-je obtenir ?

Flux, pics horaires, tendances saisonnières, attractivité.

Comment ça marche ?

Sans travaux, sans câblage. Un point de passage suffit.

cas comptage piétons
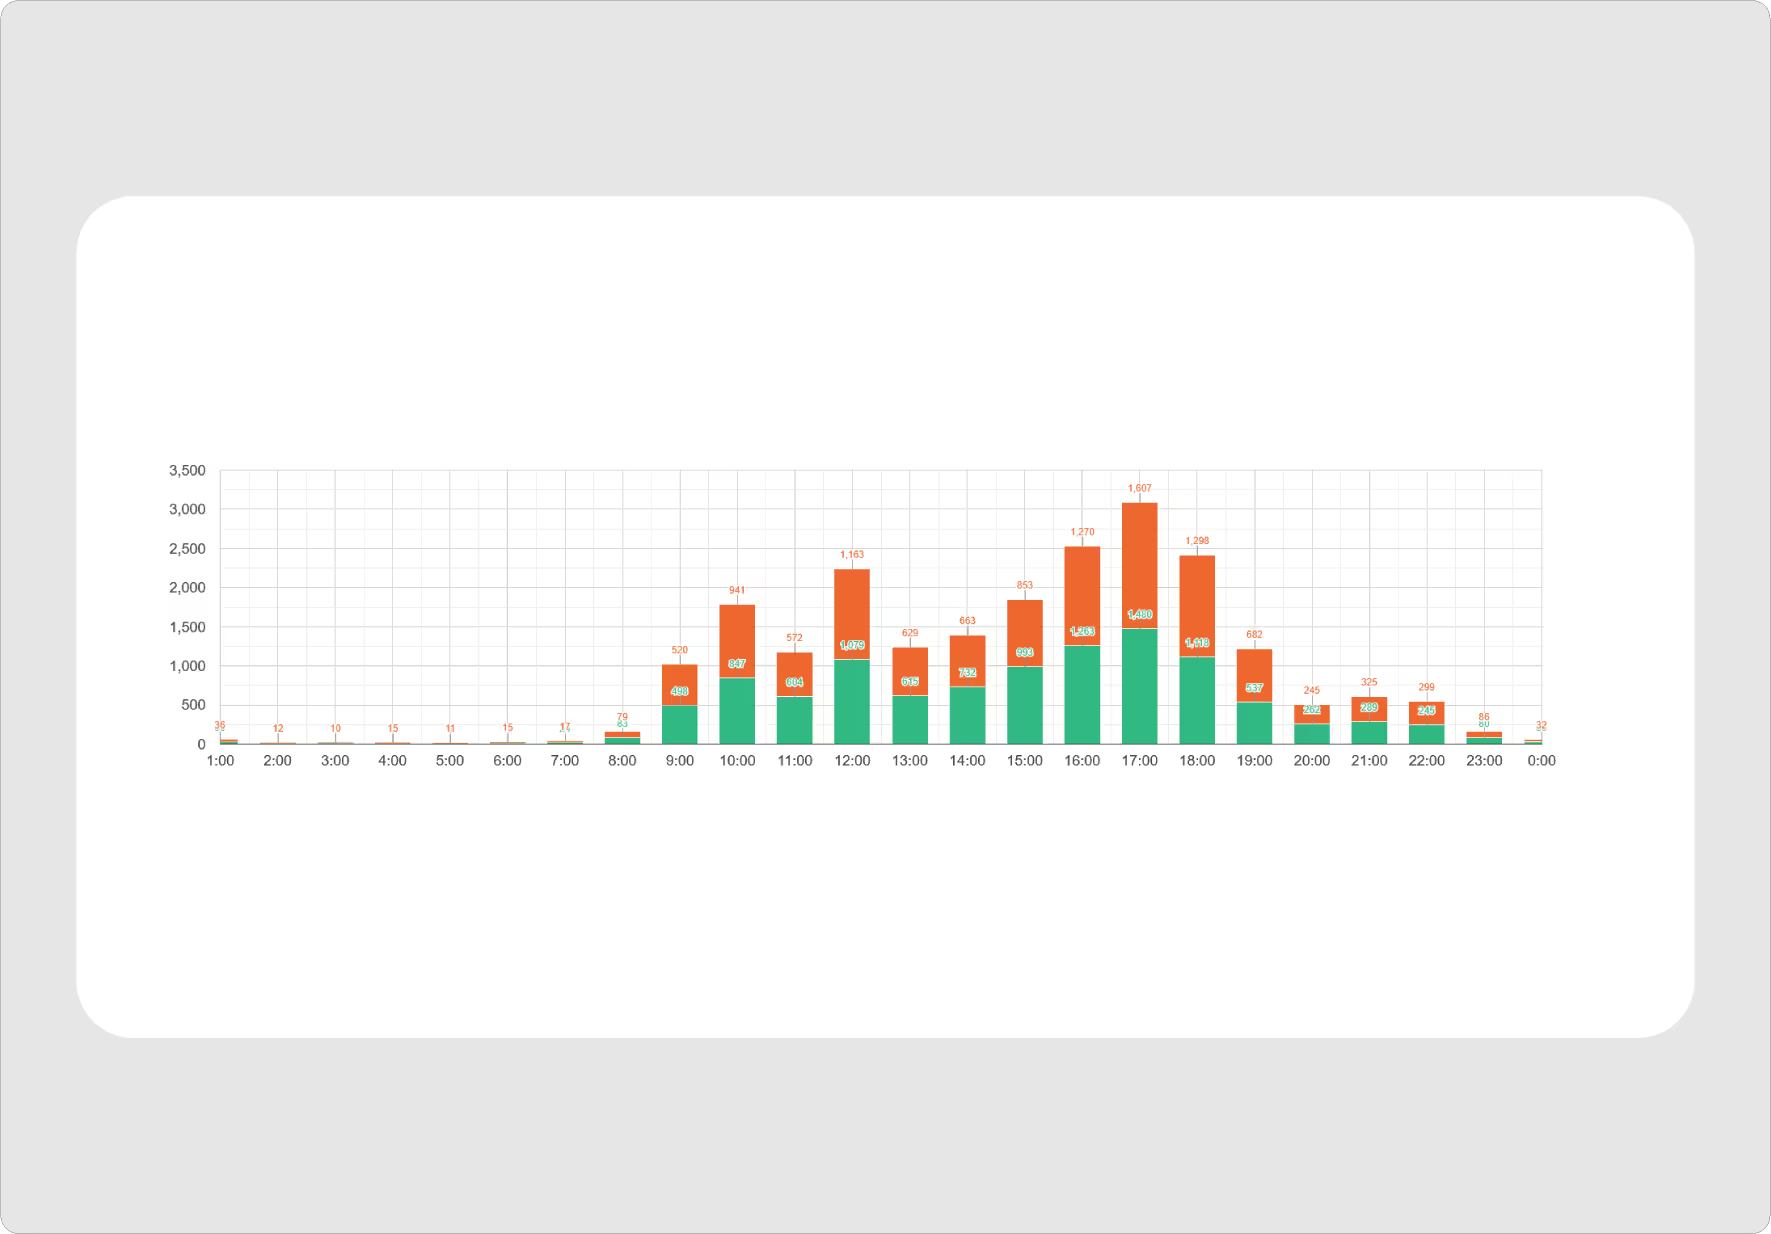
When does footfall peak on this street?
Identify peak hours to support urban planning or events decisions.
Which time slots see the most visitor traffic?
Compare actual usage with bookings to adjust room planning.
When does footfall exceed expected capacity?
Monitor peak hours to right-size reception staffing and streamline operations.
At what point does attendance become difficult to manage?
Visualize peak traffic to reinforce security and streamline access.
What is the real pressure on this trail over the seasons?
Identify sensitive periods to protect the natural environment and organize interventions.
When does my park get the most visitors?
Understand visitor inflows and attendance patterns to adjust maintenance and visitor services..
Département Haute Vienne
Département de la Corrèze
StadteRegion Aachen
AA-Ville de Paris
Département Dordogne
Département Côte d'Armor
Département Ile et Vilaine
A - CD Oise Tourisme
Communauté de Commune Pays de Mont Blanc
Ville de Bourg en Bresse
STVS
Bitek Tekecomunicationes
Communauté de Communes Chinon Vienne et Loire
Festival Ca sonne à la Porte
Musée National de Pau
Ville de Dijon
Playground Events
Communauté de Communes Le Grésivaudan
Vinci Constructions - Grands Projets
Novom Interactive
Niort Agglo
Département Haute Vienne
Chambre d'Agriculture De La Loire
Bitek Tekecomunicationes
Festival Ca sonne à la Porte
Le Millesium
Novom Interactive
Département Côte d'Armor
Ville de Bourg en Bresse
StadteRegion Aachen
Swiss Traffic
AA-Ville de Paris
Thonon Agglomération
Ville de Landerneau
Métropole du Grand Lyon
Ville de Dijon
Commune Val d’Ille-Aubigné
Ville de Landerneau
Musée National de Pau
Niort Agglo

Understanding

Measurement

Flows are irregular — but their trends are discernible.

Pedestrians stop, diverge, change pace. These variations don't make measurement impossible; they make it necessary. Even in complex environments, flows produce stable and actionable trends.

Webflow Template - Designed by Azwedo.com and Wedoflow.com
Hourly peaks and seasonal pressures
Webflow Template - Designed by Azwedo.com and Wedoflow.com
Attractiveness of a site or a route
Webflow Template - Designed by Azwedo.com and Wedoflow.com
Temporary saturation during an event
Feasibility

Can my site truly be measured?

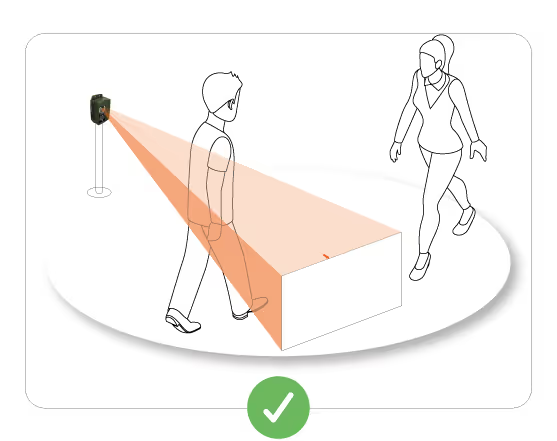
In most cases, yes. You just need to identify a natural passage point: an entrance, a bottleneck, a corridor. Our job is to analyze your setup, locate this point, and adapt the sensor's positioning.

Webflow Template - Designed by Azwedo.com and Wedoflow.com
The goal is not to track every individual
Webflow Template - Designed by Azwedo.com and Wedoflow.com
But to read the usage trends that shape visitor numbers

Adapt Verdilo to your site

Every setup is different. The Kiomda team analyzes your passage point and recommends the most suitable solution, with no obligation.

The Verdilo counter

Thermal, autonomous, and mobile passage counter

Designed for outdoor environments, without construction or wiring.

Pedestrians
Cyclists
Vehicles
Autonomy
2 years
Installation
2 minutes
Range
1 to 6 m (12 m optional)
Accuracy
± 10 %
Weight
300 g
Connectivity
Sigfox / LTE-M / Wi-Fi
Certification
IP68

Highlights

Icone batterie

Autonomous

Battery-powered, no mains connection required. Estimated battery life: 2+ years.

Icone portée étendue

Quick installation

Up and running in 2 minutes, no expertise needed, delivered ready to use.

Icone solide

Weatherproof & robust

Designed for outdoor conditions, in natural or urban environments.

Compteur discret

Anonymous data

No images stored, fully GDPR compliant.

compteur double sens

Bidirectional counting & mode differentiation

Independently identifies pedestrians, cyclists and vehicles depending on configuration.

accès simple aux données de fréquentation lightbulb

Easy data access

View data online or retrieve it manually in areas without connectivity.

How it works

Step 1

The sensor detects every pass

Thermal technology: the sensor reads the body heat of each user. No cameras, no images, no personal data.

Webflow Template - Designed by Azwedo.com and Wedoflow.com
Detection in both directions
Webflow Template - Designed by Azwedo.com and Wedoflow.com
Distinguishes (or excludes) pedestrians, cyclists, vehicles
Webflow Template - Designed by Azwedo.com and Wedoflow.com
Full GDPR compliance

Step 2

The device records and classifies

Each passage is timestamped and classified by mode and direction.
Data is aggregated into 15-minute intervals directly within the device.

Webflow Template - Designed by Azwedo.com and Wedoflow.com
Granularity: 15-minute intervals
Webflow Template - Designed by Azwedo.com and Wedoflow.com
Classification by mode and direction
Webflow Template - Designed by Azwedo.com and Wedoflow.com
Secure local storage

Step 3

Data goes to the cloud

Depending on the chosen frequency (from 5 minutes to 24 hours), the device sends its data via the available network.
If there's no network, local Wi-Fi data collection is still possible.

Webflow Template - Designed by Azwedo.com and Wedoflow.com
Automatic transmission every 12 hours
Webflow Template - Designed by Azwedo.com and Wedoflow.com
Sigfox, LTE-M, Wi-Fi
Webflow Template - Designed by Azwedo.com and Wedoflow.com
Local data collection if no network coverage

Step 4

Your data, readable at a glance

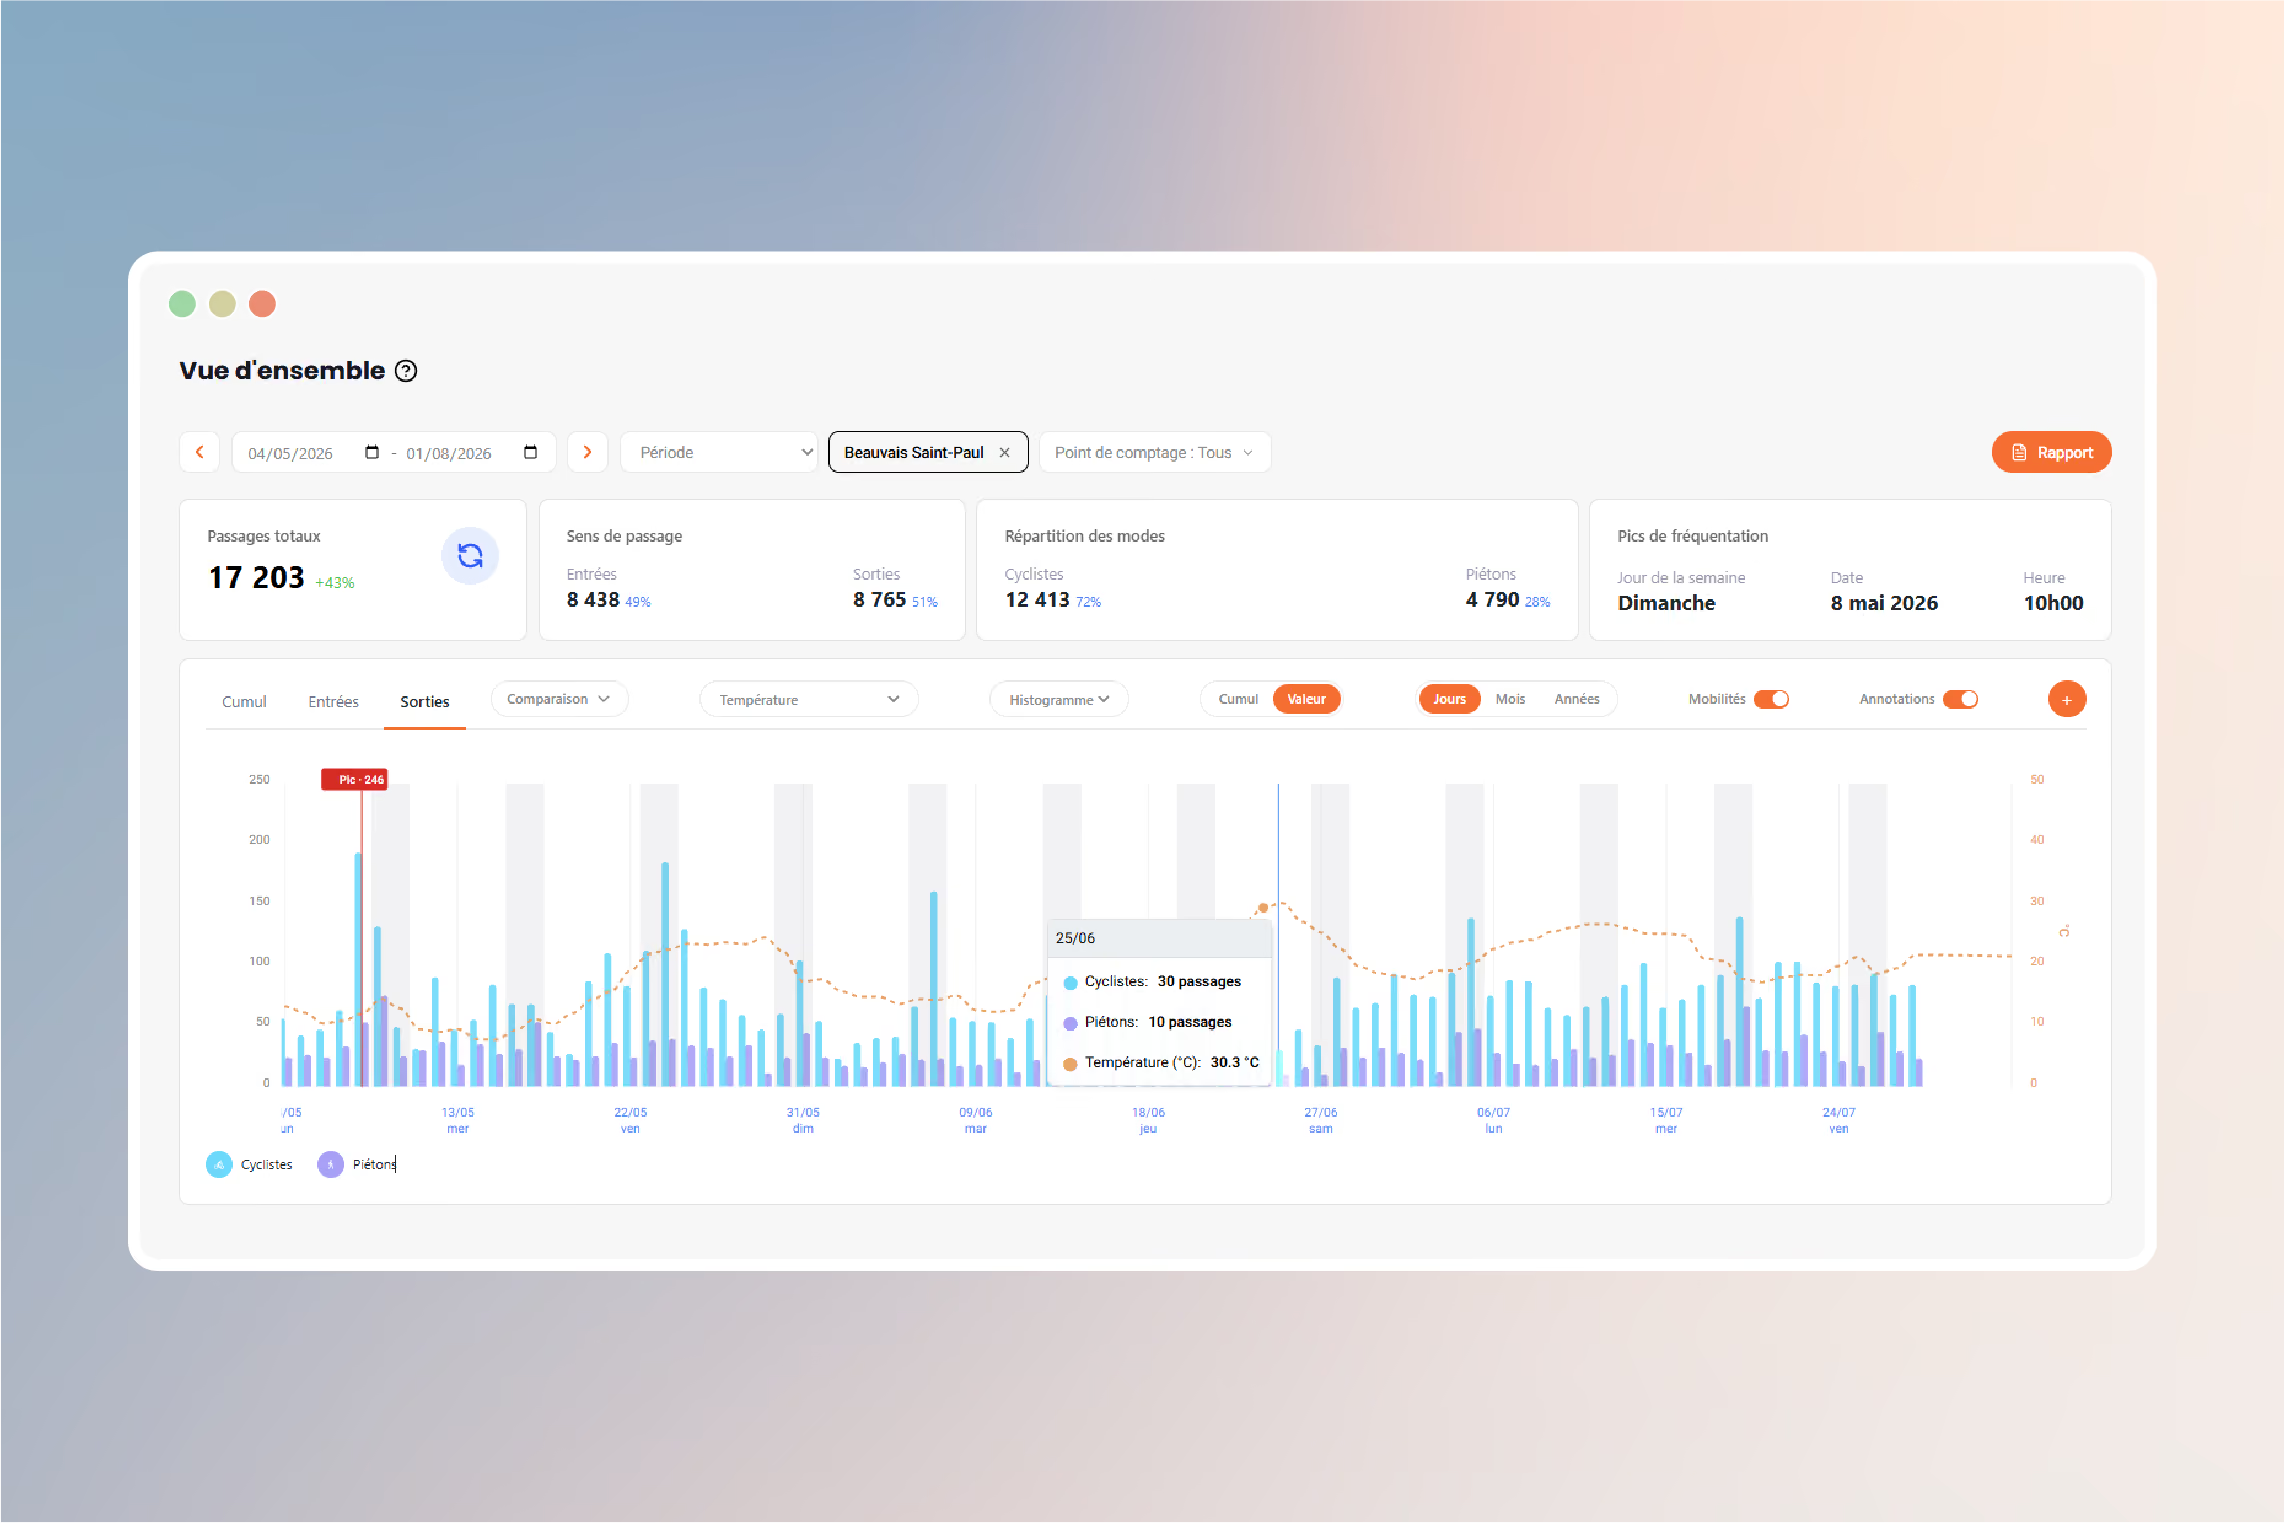
The Kiomda Report platform displays hourly curves, daily totals, and seasonal comparisons from any browser

Webflow Template - Designed by Azwedo.com and Wedoflow.com
Histograms, curves, CSV / PDF exports
Webflow Template - Designed by Azwedo.com and Wedoflow.com
Daily / weekly / seasonal comparisons
Webflow Template - Designed by Azwedo.com and Wedoflow.com
Web access, no installation

Available casings

icone roue crantée

Practical guides

What pedestrian data brings immediately

The aim of measurement is never to “make a number.” It is used to support concrete decisions.
How to count pedestrian traffic
icone public compteur autonome
Adapt site management

Operational decisions based on real usage

Adjust maintenance and opening hours

Scale teams according to attendance cycles

Prioritise interventions in sensitive areas

capteur mobilité piétons
Support decisions with objective data

Data to justify and build the case for projects

Support budget requests

Compare footfall before and after infrastructure changes

Measure the impact of an event or activation

password icon
Understand usage patterns

See what the eye cannot

Identify hourly peaks and periods under pressure

Monitor seasonal variations in footfall

Assess the attractiveness of a site or route

Case Studies

Testimonials

Request a personalized quote

Each site is different — we help you choose the easiest and most reliable configuration.

1
2
3

Build your counting project in a few clicks

1
2
3

Tell us about your project

Add here all the details you think are useful: specific context, objectives, constraints...

1
2
3

Your contact details

For our team to analyze your project, and contact you quickly to finalize your project with a quote.

Previous
Next
Form completed

Thanks! Your project has been saved successfully

Our team will contact you very quickly to deepen your needs and build an adapted proposal.

Oops! Something went wrong while submitting the form.